In the 148 games in his career, Newton was successful on 2,682 of 4,474 tries for 32,382 yards. He averaged 218.8 yds per contest through the air. Newton threw for 194 touchdowns while tossing 123 picks. He lost 1,992 yds while being sacked 332 different times. His TD rate on pass attempts was 4.3% and his interception rate was 2.7%.
In the 161 games in his career, Cunningham completed 2,429 of 4,289 attempts for a total of 29,979 yards. He totaled 186.2 yds per contest through the air. Cunningham threw for 207 touchdowns while giving up 134 picks. He was driven back 2,904 yds while being sacked 484 different times. His TD percentage was 4.8% and his interception rate was 3.1%.
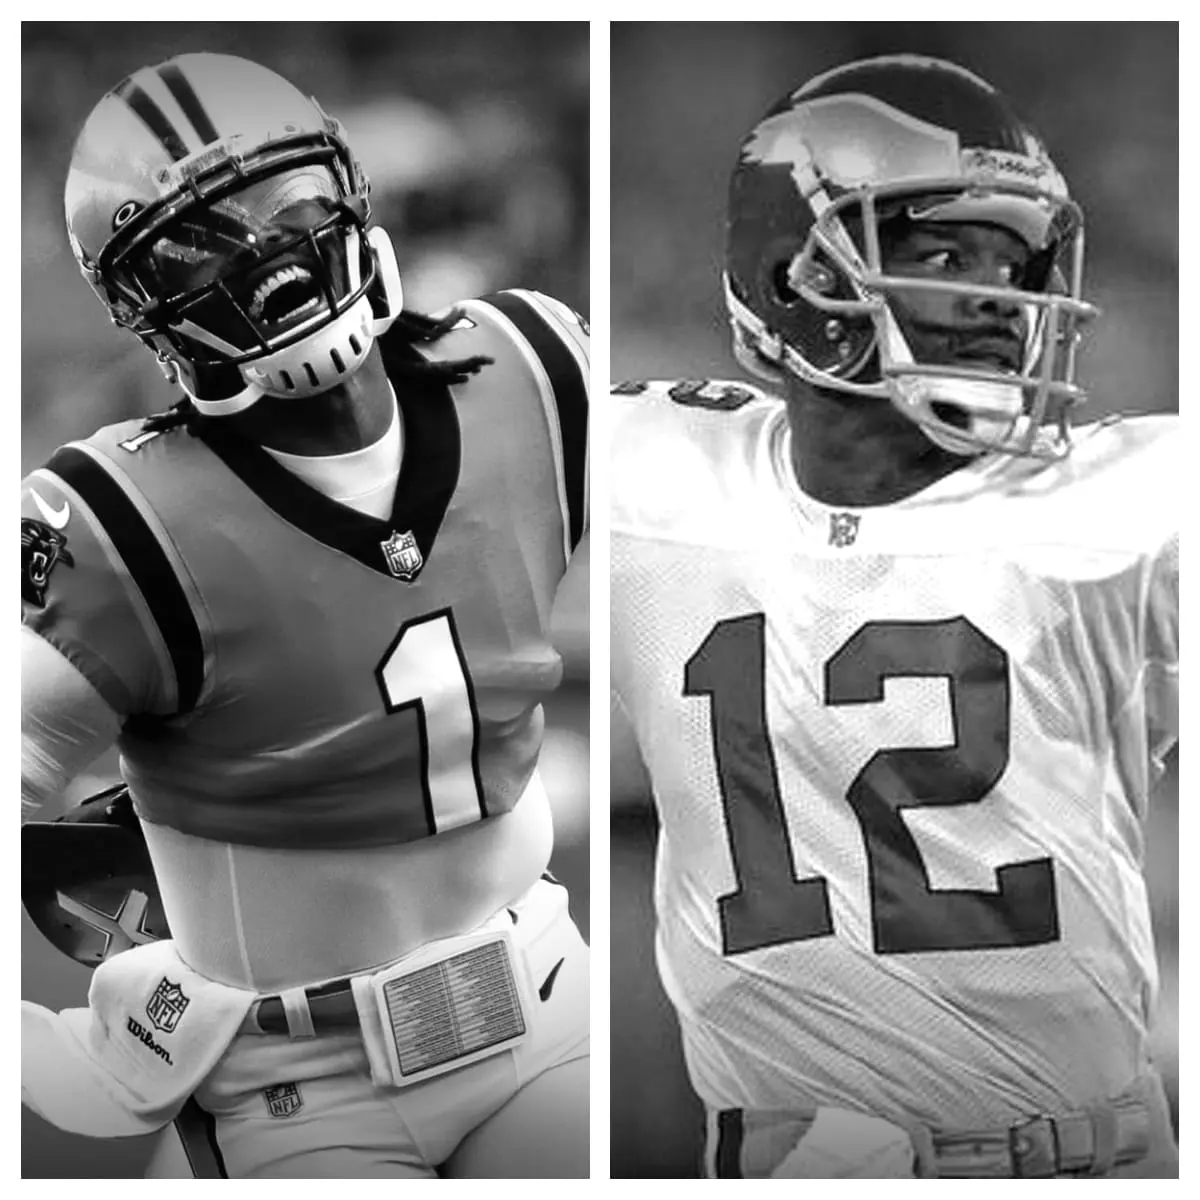
Cam Newton vs Randall Cunningham Stats<-h2>
| Cam Newton<-th> | Career<-th> | Randall Cunningham<-th><-tr><-thead> |
|---|---|---|
| 148<-td> | Games Played<-td> | 161<-td><-tr> |
| 2,682<-td> | Completions<-td> | 2,429<-td><-tr> |
| 4,474<-td> | Pass Attempts<-td> | 4,289<-td><-tr> |
| 59.9%<-td> | Completion %<-td> | 56.6%<-td><-tr> |
| 32,382<-td> | Passing Yards<-td> | 29,979<-td><-tr> |
| 194<-td> | Passing Touchdowns<-td> | 207<-td><-tr> |
| 4.3%<-td> | Touchdown Percentage<-td> | 4.8%<-td><-tr> |
| 123<-td> | Interceptions<-td> | 134<-td><-tr> |
| 2.7%<-td> | Interception Percentage<-td> | 3.1%<-td><-tr> |
| 7.2<-td> | Yards Per Pass Attempt<-td> | 7.0<-td><-tr> |
| 6.9<-td> | Adjusted Yards Per Pass Attempt<-td> | 6.5<-td><-tr> |
| 12.1<-td> | Yards Per Completion<-td> | 12.3<-td><-tr> |
| 218.8<-td> | Passing Yards Per Game<-td> | 186.2<-td><-tr> |
| 332<-td> | Times Sacked<-td> | 484<-td><-tr> |
| 7.4%<-td> | Sack Percentage<-td> | 11.3%<-td><-tr><-tr><-tbody><-table>
Subscribe
Login
Please login to comment
0 Comments
Oldest
|