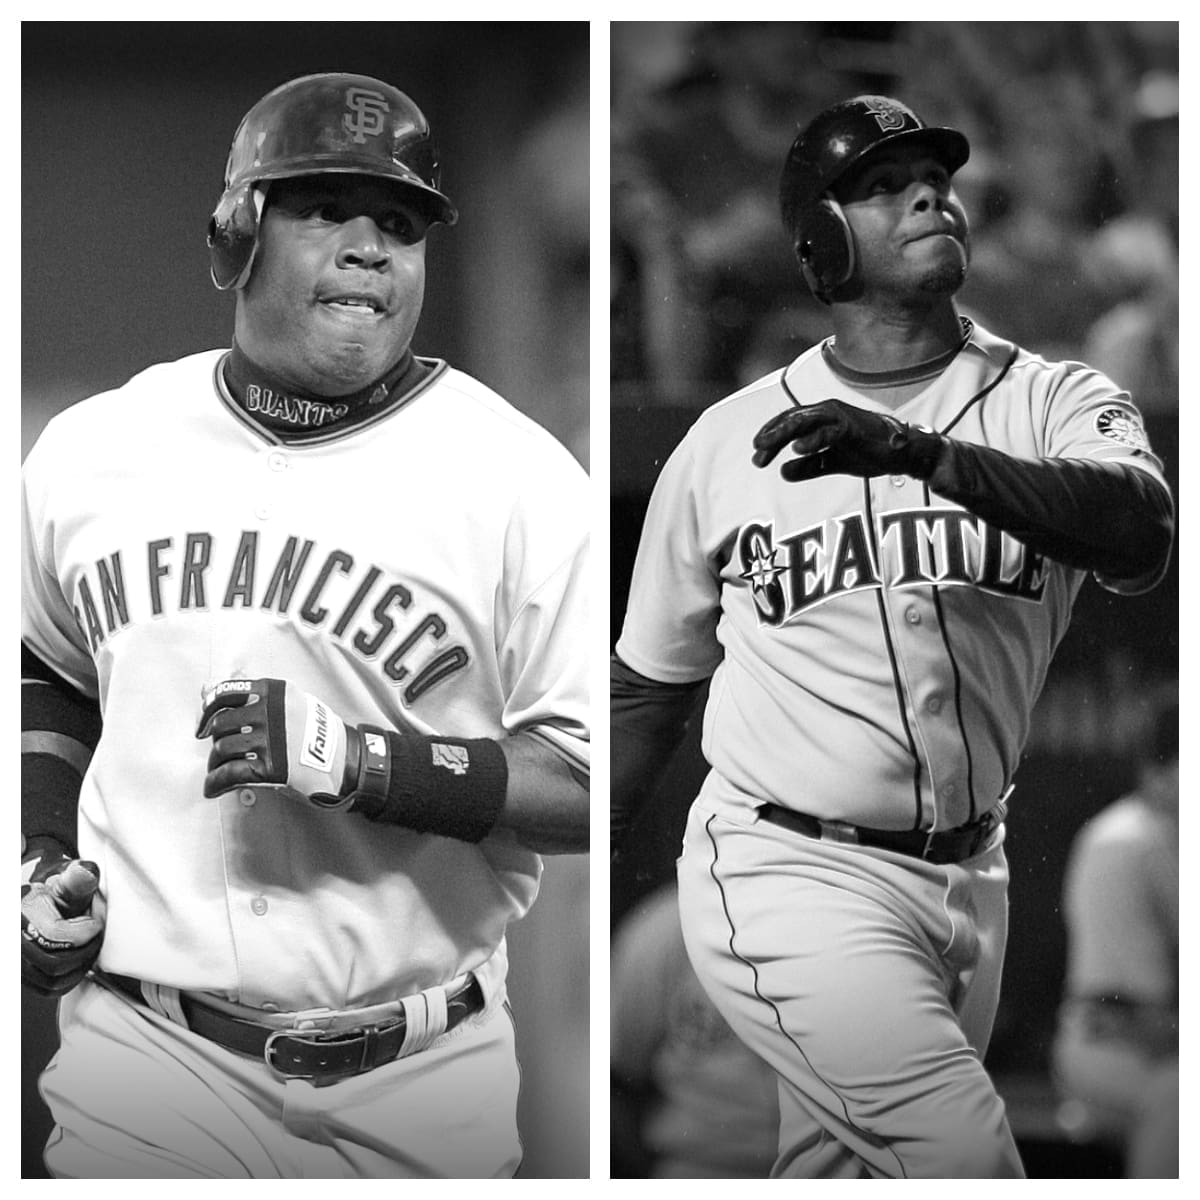
Bonds has accrued an average at the plate of .298 for his time in baseball with 2,227 runs scored and an OPS of .311. He has struck out 1,539 times and has walked on 2,558 occasions, which has contributed to a .444 OBP. For his professional baseball career, Bonds has slapped 762 baseballs over the fence while driving in 1,996 runs. He has compiled a slugging percentage of -.133 in addition to racking up 5,976 bases. Over the course of his pro career, he approached the plate 12,606 times and has come through with a base hit 2,935 times.
Griffey Jr. has drawn a free base 1,312 times while striking out on 1,779 plate appearances. His on-base percentage is .370 and he holds a career OPS of .292. He has a total of 1,662 runs and has 1,836 runs batted in. He has hit a home run 630 times, with 5,271 bases in total and a -.077 slugging %. For the 9,801 at-bats in his career, Griffey Jr. has a batting average of .284 in addition to having 2,781 hits.
| Barry Bonds | Career | Ken Griffey Jr. |
|---|---|---|
| 2,986 | Games Played | 2,671 |
| 12,606 | Plate Appearances | 11,304 |
| 9,847 | At-Bats | 9,801 |
| 2,227 | Runs | 1,662 |
| 2,935 | Hits | 2,781 |
| 601 | Doubles | 524 |
| 77 | Triples | 38 |
| 762 | Home Runs | 630 |
| 1,996 | Runs Batted In | 1,836 |
| 514 | Stolen Bases | 184 |
| 141 | Caught Stealing | 69 |
| 2,558 | Walks | 1,312 |
| 1,539 | Strikeouts | 1,779 |
| .298 | Batting Average | .284 |
| .444 | On-Base Percentage | .370 |
| -.133 | Slugging Percentage | -.077 |
| 0.311 | OPS | 0.292 |
| 5,976 | Total Bases | 5,271 |
| 165 | Grounded Into Double Plays | 199 |
| 106 | Hit By Pitch | 81 |