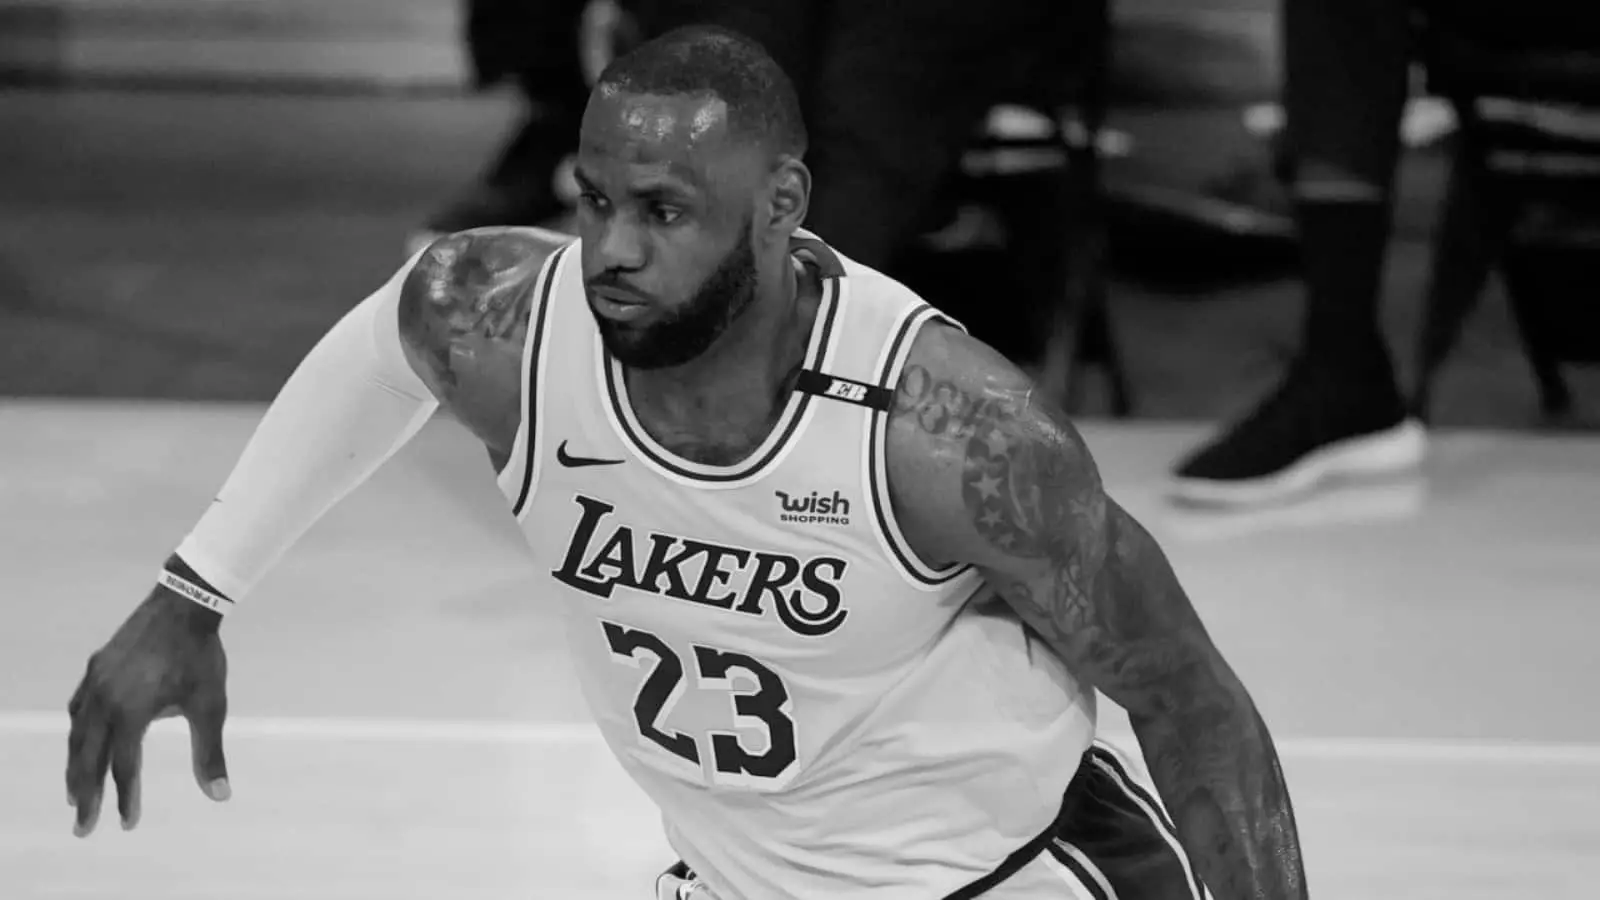
LeBron James has stepped onto the hardwood in 1,606 games so far in his career and accumulated 60,497 minutes in those games. James has started in 1,604 games, and in those matchups he sports an average of 26.9 points per game and has amassed 43,127 points overall. He earns 25.7 points per 36 minutes, as well as snagging 7.1 rebounds and earning 7.1 dimes in his NBA career. By putting in 15,842 shots of 31,285 attempts, James has accrued a 50.6% shooting percentage. By knocking down 2,622 out of 7,523 shots from behind the arc, he has earned a 3pt rate of 34.9%. By knocking down 13,220 of 23,762 2pt attempts, he has earned an average of 55.6%. James has converted 8,821 out of 11,966 attempts from the foul line, which gave him a rate of 73.7%. With an effective FG percentage of 54.8%, he has also had 2,840 personal fouls as well as 5,605 turnovers. Sitting with 10,148 defensive rebounds and 1,831 on the offensive end, James is sitting with 11,979 rebounds in total in his NBA career. He has recorded 2,393 steals, as well as 1,178 rejections and 11,892 assists. When discussing stats per game, James averages 7.4 dimes and 7.5 rebounds.
Michael Jordan is sitting with 41,011 mins and has taken the court in 1,072 contests so far in his career. Jordan has accumulated 32,292 points so far in his NBA career, comes in with an average of 30.1 points per game and was named a starter in 1,039 games. He dishes out 4.9 assists, pulls in 5.9 boards and accumulates 28.3 per 36 mins. With a shooting rate of 49.7%, Jordan has made 12,192 shots out of 24,537 attempts. Having shot 1,778 three point tries in his NBA career, he has recorded a shooting percentage of 32.7% by converting 581 of those shots. He has recorded a 51.0% shooting percentage of by knocking down 11,611 out of his 22,759 shot attempts. Jordan has tallied a 83.5% percentage at the free throw line by making 7,327 out of his 8,772 shots. Stepping onto the court with an effective field goal rate of 50.9%, he has additionally recorded 2,924 giveaways and recorded 2,783 fouls. He has accounted for 6,672 rebounds in total during his career by pulling down 5,004 on the defensive end and 1,668 of the offensive sort. When discussing sharing the basketball, Jordan has earned 5,633 assists, as well as adding 2,514 steals and 893 rejections. He is averaging 6.2 rebounds in addition to 0.0 assists per game.
LeBron James vs Michael Jordan Stats
| LeBron James | Career | Michael Jordan |
|---|---|---|
| 1,606 | Games Played | 1,072 |
| 1,604 | Games Started | 1,039 |
| 60,497 | Minutes Played | 41,011 |
| 15,842 | Field Goals Made | 12,192 |
| 31,285 | Field Goals Attempted | 24,537 |
| 50.6% | Field Goal Percentage | 49.7% |
| 2,622 | 3-Pointers Made | 581 |
| 7,523 | 3-Pointers Attempted | 1,778 |
| 34.9% | 3-Point Percentage | 32.7% |
| 13,220 | 2-Pointers Made | 11,611 |
| 23,762 | 2-Pointers Attempted | 22,759 |
| 55.6% | 2-Point Percentage | 51.0% |
| 54.8% | eFG% | 50.9% |
| 8,821 | Free Throws Made | 7,327 |
| 11,966 | Free Throws Attempted | 8,772 |
| 73.7% | Free Throw Percentage | 83.5% |
| 1,831 | Offensive Rebounds | 1,668 |
| 10,148 | Defensive Rebounds | 5,004 |
| 11,979 | Total Rebounds | 6,672 |
| 11,892 | Assists | 5,633 |
| 2,393 | Steals | 2,514 |
| 1,178 | Blocks | 893 |
| 5,605 | Turnovers | 2,924 |
| 2,840 | Personal Fouls | 2,783 |
| 43,127 | Points Scored | 32,292 |
| 26.9 | Points Per Game | 30.1 |
| 37.7 | Minutes Per Game | 38.3 |
| 7.4 | Assists Per Game | 5.3 |
| 7.5 | Rebounds Per Game | 6.2 |
| 25.7 | Points Per 36 Minutes | 28.3 |
| 7.1 | Rebounds Per 36 Minutes | 5.9 |
| 7.1 | Assists Per 36 Minutes | 4.9 |