Peterson averaged 81.1 yards on the ground per game in his career. He has rushed for 120 touchdowns. His average yds per carry is at 4.6 and he carried the ball 3,230 times. Adrian Peterson gained 14,918 yds on the ground in 184 games played in his career.
Gore coughed up the ball 0 different times in his career. He rushed for 66.4 yds per game and got into the endzone 81 times on the ground. He was handed the ball 3,735 different times to the tune of 4.3 yards per attempt. During his NFL career, Gore took the field in 241 contests and gained 16,000 yards on the ground.
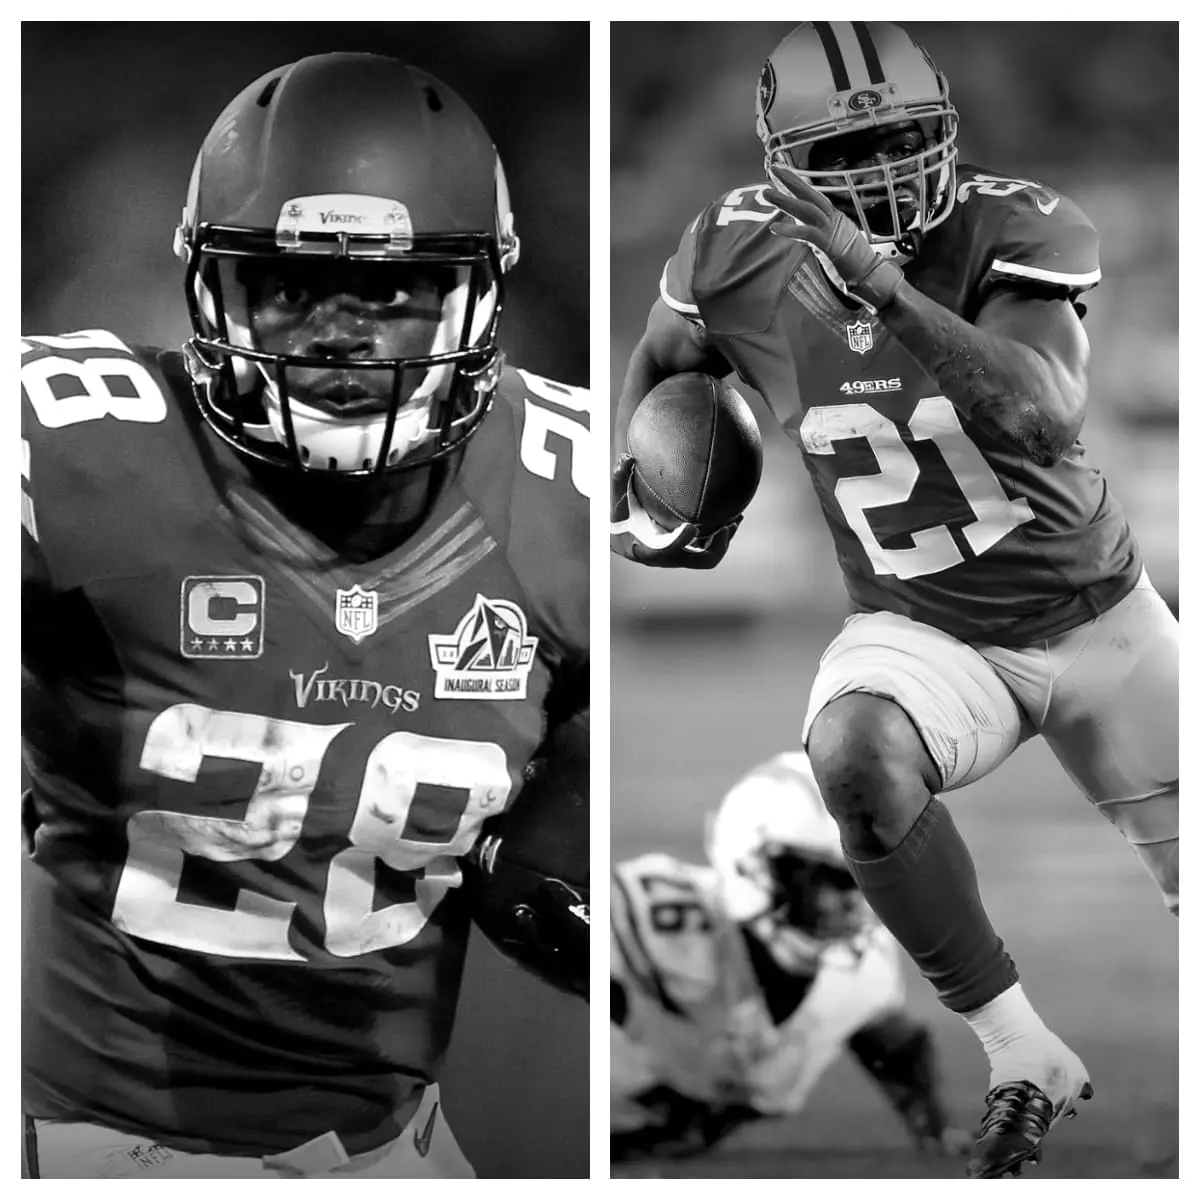
Adrian Peterson vs Frank Gore Stats<-h2>
| Adrian Peterson<-th> | Career<-th> | Frank Gore<-th><-tr><-thead> |
|---|---|---|
| 184<-td> | Games Played<-td> | 241<-td><-tr> |
| 3,230<-td> | Rushing Attempts<-td> | 3,735<-td><-tr> |
| 14,918<-td> | Rushing Yards<-td> | 16,000<-td><-tr> |
| 120<-td> | Rushing TD<-td> | 81<-td><-tr> |
| 717<-td> | 1st Downs by Rushing<-td> | 731<-td><-tr> |
| 0<-td> | Longest Run<-td> | 0<-td><-tr> |
| 4.6<-td> | Yards Per Carry<-td> | 4.3<-td><-tr> |
| 81.1<-td> | Rushing Yards Per Game<-td> | 66.4<-td><-tr> |
| 0<-td> | Fumbles<-td> | 0<-td><-tr> |