Jimmy Butler has stepped onto the hardwood in 869 contests in his career and recorded 28,790 mins in those games. Butler got the starting nod in 764 games, and in those matchups he is averaging 18.3 points per contest and is sitting with 15,898 points overall. He accounts for 19.9 points per 36 mins, in addition to pulling down 5.8 rebounds and collecting 4.7 dimes in his NBA career. By making 5,147 baskets of his 10,909 attempts, Butler has a 47.2% shooting percentage. By converting 684 out of 2,084 shots from 3-point land, he has accumulated a 3pt rate of 32.8%. By knocking down 4,463 out of his 8,825 two-point shot attempts, he has recorded a rate of 50.6%. Butler has made 4,920 of his 5,833 shots from the free throw line, putting him at a percentage of 84.3%. Sitting with an effective FG% of 50.3%, he has also had 1,196 fouls and 1,399 giveaways. With 3,206 defensive boards and 1,441 offensive, Butler has recorded 4,647 total rebounds thus far in his career. He has earned 1,400 steals, in addition to 379 blocks and 3,772 dimes. When talking about per game stats, Butler averages 4.3 dimes in addition to 5.3 rebounds.
Michael Jordan has accumulated 41,011 mins and has taken part in 1,072 contests so far in his career. Jordan has accrued 32,292 pts so far in his pro basketball career, averages 30.1 PPG and was named a starter in 1,039 matchups. He earns 4.9 assists, snags 5.9 rebounds and tallies 28.3 per 36 minutes. Having earned a field goal % of 49.7%, Jordan has knocked down 12,192 shots of his 24,537 tries. Having shot 1,778 3PT tries in his pro basketball career, he has recorded a shooting percentage of 32.7% by converting 581 of those shots. He has recorded a 51.0% shooting percentage of by way of making 11,611 of his 22,759 tries. Jordan has accumulated a 83.5% rate from the foul line by converting 7,327 of 8,772 shot attempts. While he has earned an effective FG% of 50.9%, he has also had a total of 2,924 turnovers and tallied 2,783 infractions. He has accrued 6,672 boards in total during his career by way of 5,004 on the defensive side of the court and 1,668 of the offensive sort. With respect to making his teammates better, Jordan has accounted for 5,633 assists, in addition to putting up 2,514 steals and 893 blocks. He averages 6.2 boards and 0.0 assists per game.
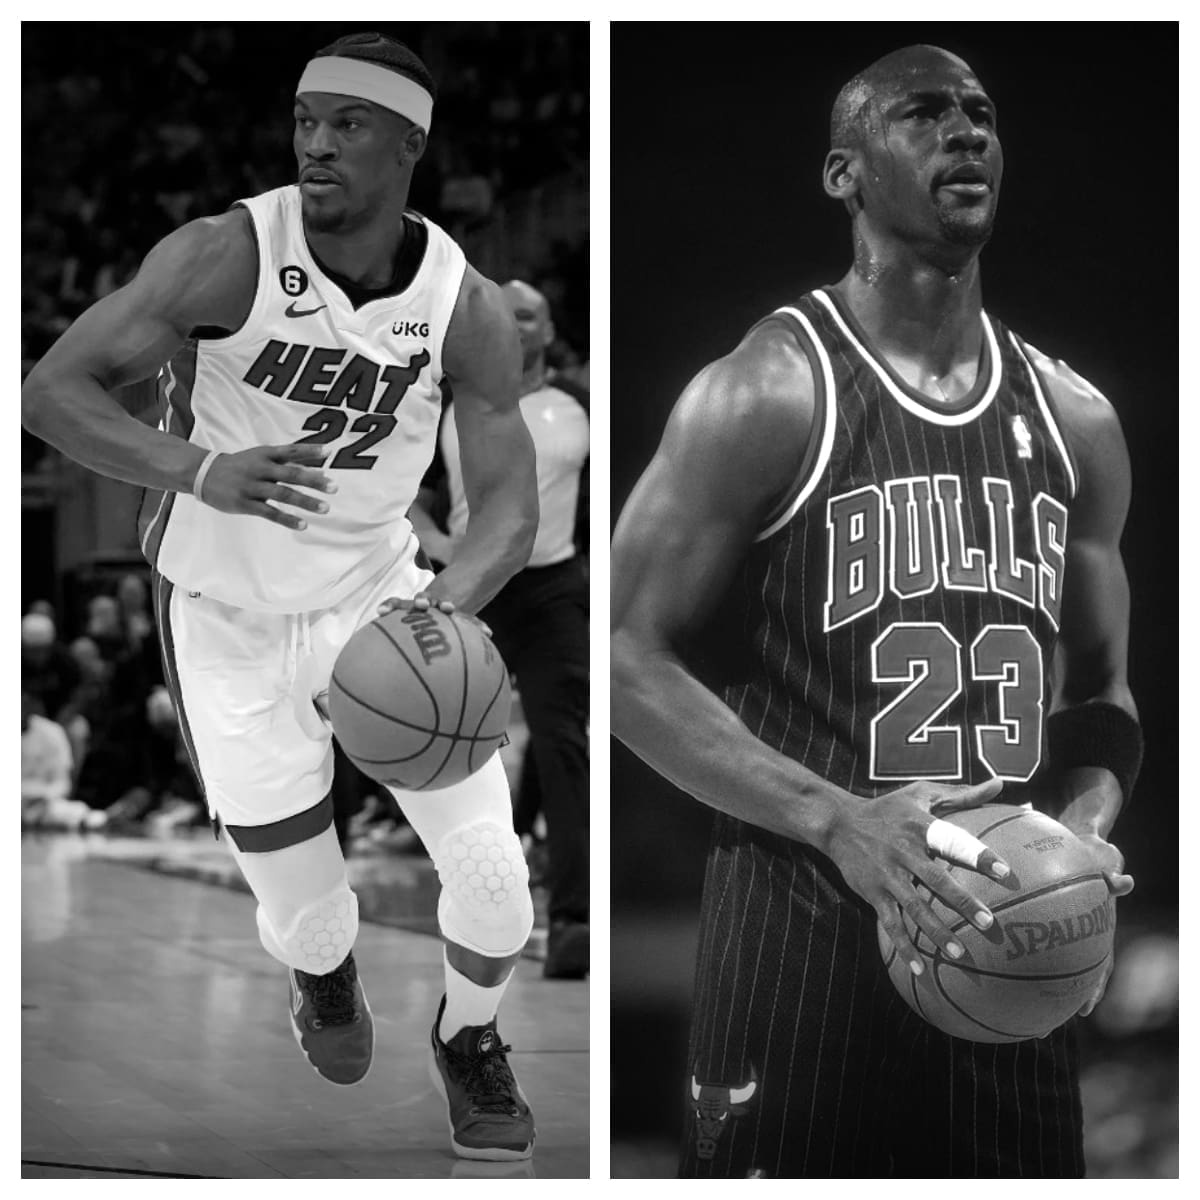
Jimmy Butler vs Michael Jordan Stats
| Jimmy Butler | Career | Michael Jordan |
|---|---|---|
| 869 | Games Played | 1,072 |
| 764 | Games Started | 1,039 |
| 28,790 | Minutes Played | 41,011 |
| 5,147 | Field Goals Made | 12,192 |
| 10,909 | Field Goals Attempted | 24,537 |
| 47.2% | Field Goal Percentage | 49.7% |
| 684 | 3-Pointers Made | 581 |
| 2,084 | 3-Pointers Attempted | 1,778 |
| 32.8% | 3-Point Percentage | 32.7% |
| 4,463 | 2-Pointers Made | 11,611 |
| 8,825 | 2-Pointers Attempted | 22,759 |
| 50.6% | 2-Point Percentage | 51.0% |
| 50.3% | eFG% | 50.9% |
| 4,920 | Free Throws Made | 7,327 |
| 5,833 | Free Throws Attempted | 8,772 |
| 84.3% | Free Throw Percentage | 83.5% |
| 1,441 | Offensive Rebounds | 1,668 |
| 3,206 | Defensive Rebounds | 5,004 |
| 4,647 | Total Rebounds | 6,672 |
| 3,772 | Assists | 5,633 |
| 1,400 | Steals | 2,514 |
| 379 | Blocks | 893 |
| 1,399 | Turnovers | 2,924 |
| 1,196 | Personal Fouls | 2,783 |
| 15,898 | Points Scored | 32,292 |
| 18.3 | Points Per Game | 30.1 |
| 33.1 | Minutes Per Game | 38.3 |
| 4.3 | Assists Per Game | 5.3 |
| 5.3 | Rebounds Per Game | 6.2 |
| 19.9 | Points Per 36 Minutes | 28.3 |
| 5.8 | Rebounds Per 36 Minutes | 5.9 |
| 4.7 | Assists Per 36 Minutes | 4.9 |