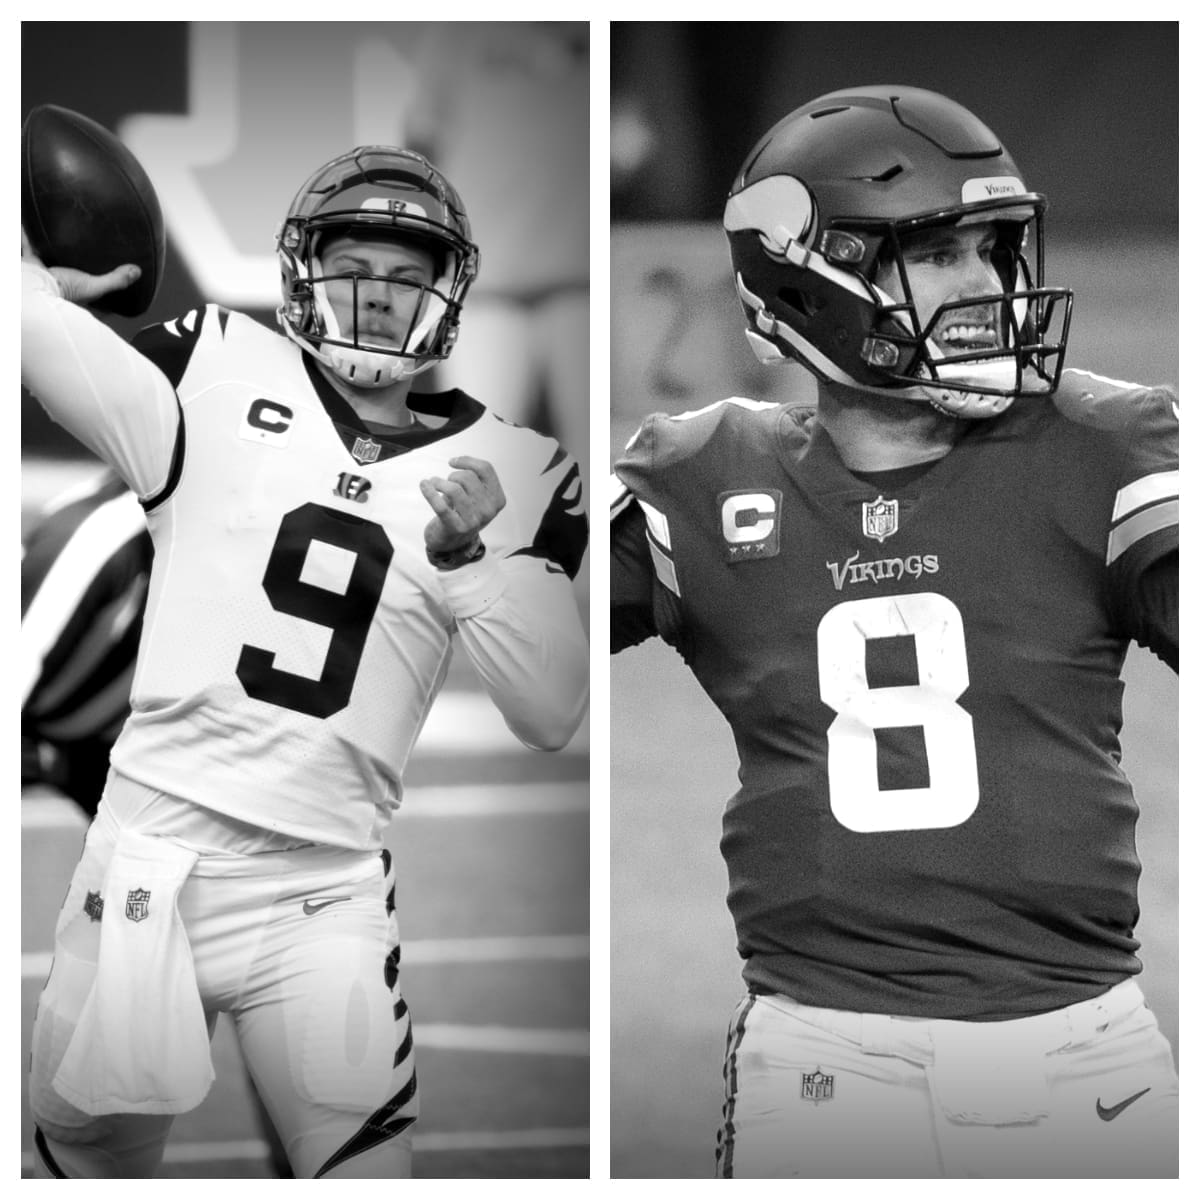
During the 69 games in his career, Burrow has been successful on 1,748 of 2,547 tries for a total of 19,001 yds. He averages 275.4 yards per contest through the air. Burrow has thrown 140 touchdowns while tossing 46 picks. He’s lost 1,176 yds while being the victim of a QB sack 196 times. His touchdown percentage on pass attempts is 5.5% and his interception rate is 1.8%.
In 164 contests in his career, Cousins has connected on 3,768 of his 5,630 attempts for a total of 42,979 yards. He averages 262.1 yards per game through the air. Cousins has thrown for 288 touchdowns while giving up 126 interceptions. He’s lost a combined 1,992 yds while being the victim of a quarterback sack 332 times. His TD percentage is 5.1% and his interception percentage is 2.2%.
Joe Burrow vs Kirk Cousins Stats<-h2>
| Joe Burrow<-th> | Career<-th> | Kirk Cousins<-th><-tr><-thead> |
|---|---|---|
| 69<-td> | Games Played<-td> | 164<-td><-tr> |
| 1,748<-td> | Completions<-td> | 3,768<-td><-tr> |
| 2,547<-td> | Pass Attempts<-td> | 5,630<-td><-tr> |
| 68.6%<-td> | Completion %<-td> | 66.9%<-td><-tr> |
| 19,001<-td> | Passing Yards<-td> | 42,979<-td><-tr> |
| 140<-td> | Passing Touchdowns<-td> | 288<-td><-tr> |
| 5.5%<-td> | Touchdown Percentage<-td> | 5.1%<-td><-tr> |
| 46<-td> | Interceptions<-td> | 126<-td><-tr> |
| 1.8%<-td> | Interception Percentage<-td> | 2.2%<-td><-tr> |
| 7.5<-td> | Yards Per Pass Attempt<-td> | 7.6<-td><-tr> |
| 7.7<-td> | Adjusted Yards Per Pass Attempt<-td> | 7.6<-td><-tr> |
| 10.9<-td> | Yards Per Completion<-td> | 11.4<-td><-tr> |
| 275.4<-td> | Passing Yards Per Game<-td> | 262.1<-td><-tr> |
| 196<-td> | Times Sacked<-td> | 332<-td><-tr> |
| 7.7%<-td> | Sack Percentage<-td> | 5.9%<-td><-tr><-tr><-tbody><-table>
Joe Burrow has rapidly become one of the most talked-about players in the NFL. His impressive performance on the field, coupled with his impressive stats, has garnered him a following of fans and analysts alike. But the question that begs to be asked is: what truly sets Joe Burrow apart from the rest of the NFL players? At the core of Burrow’s success is his dedication and drive. After being drafted by the Cincinnati Bengals in 2020, he quickly rose to prominence in the league. Despite facing injuries, he managed to come back stronger than ever, finishing the season with 2,688 passing yards and 13 touchdowns. He then showcased his talent in the 2021 season, throwing for 4,611 yards, 34 touchdowns, and only five interceptions, making him an NFL MVP candidate. One of the most impressive aspects of Burrow’s game is his accuracy. He consistently makes smart decisions and delivers the ball exactly where it needs to be. This skill has made him an invaluable asset on the field, and allowed him to lead his team to victories time and time again. In addition to his impressive stats, Burrow also brings leadership, resilience, and determination to the game. He is known for his ability to elevate the performance of his teammates, and his unwavering confidence sets an example for others to follow. Burrow’s impact on the NFL goes beyond just his performance on the field. As a young, talented athlete, he has captured the attention of fans across the country, and his consistent success has only added to his growing fan base. His positive influence on the game of football cannot be overstated, as he continues to inspire young athletes everywhere. As Joe Burrow continues to evolve as a player and leader, it is clear that his impact on the NFL will be felt for years to come. He has proven himself to be a force to be reckoned with, and is definitely a player to watch in the years ahead. Furthermore, Burrow’s impact extends beyond just the numbers. His presence on the field alone has given the struggling Bengals franchise a much-needed boost in confidence and morale. The team’s turnaround in the 2021 season can be attributed to Burrow’s leadership and ability to inspire those around him. In addition, Burrow’s success has brought renewed attention to the NFL, particularly among younger fans who may have strayed from the sport. His energetic performances and engaging persona have captured the hearts of many, both on and off the field. One cannot overlook the cultural impact that Burrow has had on the NFL as well. As a prominent figure in the league, he uses his platform to advocate for important causes and to inspire others to chase their dreams. His dedication to community service and philanthropy serves as a reminder that there is more to football than just the game itself. Overall, Joe Burrow’s impact on the NFL has been undeniably significant. His impressive stats, leadership, and personality make him a true standout in the league, and his continued success will surely inspire future generations of football players. Whether on the field or off, Burrow’s impact is felt far and wide, and his contributions to the sport will not be forgotten.  Related Posts
NFL League Minimum: History and Future TrendsThe concept of a league minimum salary in the NFL dates back to the early days of the league. It was established to ensure that all players received a 
NFL Pro Bowl History and EvolutionThe Pro Bowl’s roots can be traced back to 1939 when the first NFL All-Star Game was held. This event featured a matchup between the NFL champion and 
Best NFL Quarterbacks of All-TimeThe quarterback is often considered the most pivotal position in American football. With immense pressure and responsibility, these athletes must exhi 
NFL Honors: Recognizing the League’s Best PlayersEvery year, the NFL Honors ceremony celebrates the finest achievements in professional football. This prestigious event shines a spotlight on the leag 
NFL Playoff History: Memorable MomentsThe NFL playoffs have evolved significantly since the league’s early days, reflecting changes in the sport itself and the growing popularity of profes 
Impact of NFL MVP on Player CareersThe MVP award, bestowed by the Associated Press, is a testament to a player’s exceptional talent, leadership, and influence on the field. Players like 
Strategies for Success in NFL Free AgencyNFL free agency is a period when players who are not under contract can sign with any team. It’s a critical time for teams to strengthen their squads 
How Much Do Scouts Make in the NFL?Before we dive into the specifics of an NFL scout’s salary, it’s essential to understand what exactly these professionals do. NFL scouts are responsib 
What NFL Players Did Martial Arts?The NFL is home to some of the most physically gifted athletes in the world. While football itself is a demanding sport, many NFL players have turned 
How Much is an NFL Pension?Retirement planning is crucial for everyone, including professional athletes. The National Football League (NFL) offers a pension plan to its players, 
How To Become an NFL Referee?Do you dream of being on the field during the biggest football games, making crucial calls, and ensuring fair play? Becoming an NFL referee could be y 
Where is the NFL Hall Of Fame?The Pro Football Hall of Fame, often simply referred to as the NFL Hall of Fame, is a place of reverence for fans of American football. It stands as a 
Who is the Best NFL Team Of All Time?The challenge of naming the best NFL team ever is compounded by the evolution of the game itself. Different eras have emphasized different aspects of 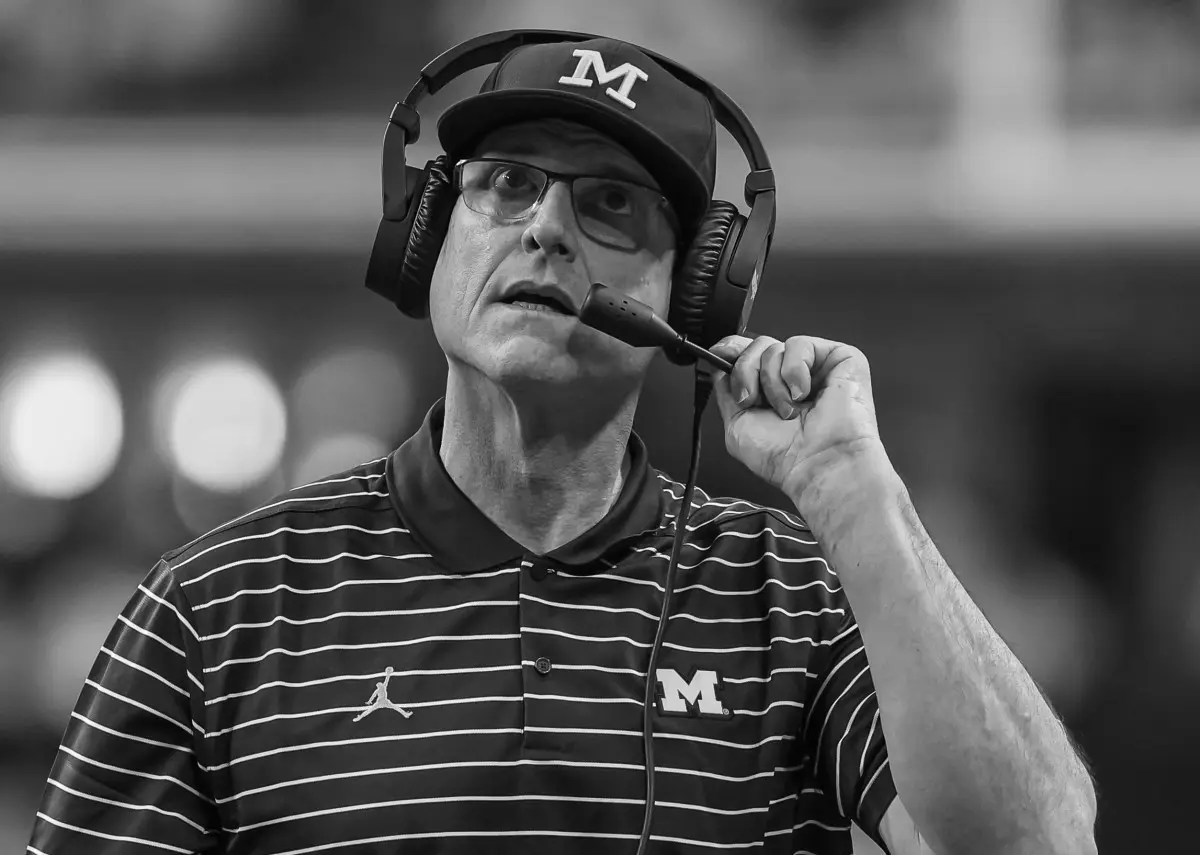
Did Jim Harbaugh Play In the NFL?When discussing prominent figures in American football, Jim Harbaugh’s name often comes up. Known for his passionate coaching style and strategic acum 
Who Has the Most Interceptions in NFL History?In the electrifying world of football, interceptions stand out as a particularly thrilling aspect of the game. They can dramatically shift momentum, o 
How Many Black Quarterbacks In the NFL?The National Football League (NFL) has a rich history that spans over a century, marked by numerous evolutions and transformations. Throughout this ti 
Which Plays Are Unreviewable In NFL?Before we dive into unreviewable plays, it’s important to understand what constitutes a reviewable play in the NFL. The primary purpose of the review 
What is the Strap Hanging from NFL Players Pants?If you’ve ever watched an NFL game, you might have noticed a curious piece of equipment that many players have hanging from their pants. It’s not unco |