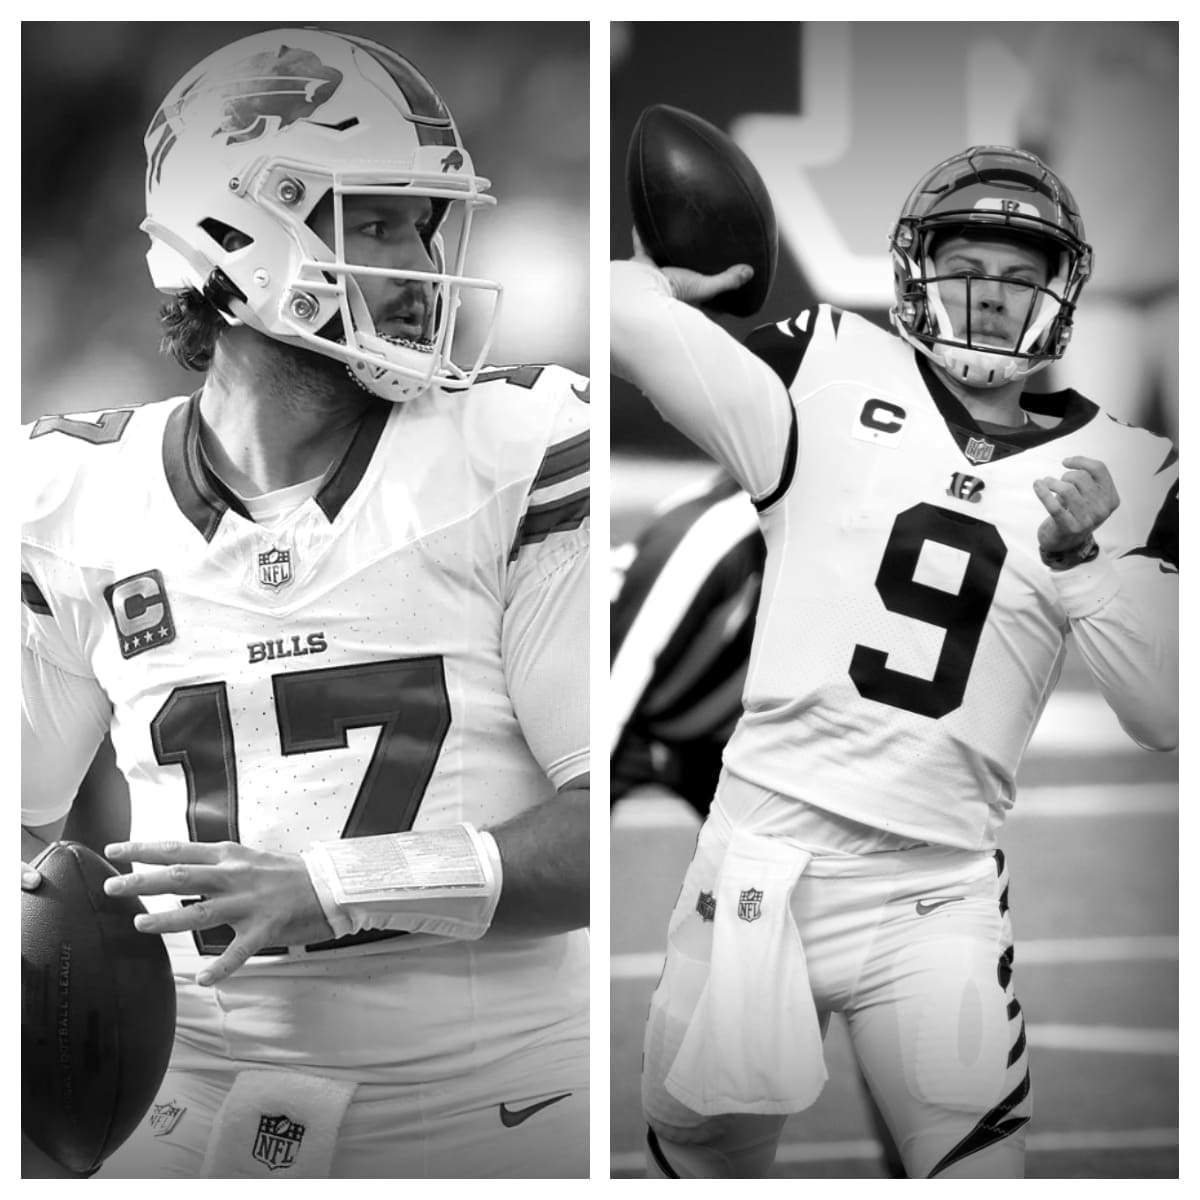
Allen has thrown 195 touchdowns while giving up 84 picks. His touchdown percentage is 5.4% and his interception percentage is 2.3%. He’s lost a total of 1,134 yards while being the victim of a QB sack 189 different times. He is averaging 238.1 passing yards per game. In the 111 contests in his career, Allen has completed 2,296 of his 3,628 tries for 26,434 yds.
During the 69 games in his career, Burrow has been successful on 1,748 of 2,547 tries for a total of 19,001 yds. He averages 275.4 yards per contest through the air. Burrow has thrown 140 touchdowns while tossing 46 picks. He’s lost 1,176 yds while being the victim of a QB sack 196 times. His touchdown percentage on pass attempts is 5.5% and his interception rate is 1.8%.
Josh Allen vs Joe Burrow Stats<-h2>
| Josh Allen<-th> | Career<-th> | Joe Burrow<-th><-tr><-thead> |
|---|---|---|
| 111<-td> | Games Played<-td> | 69<-td><-tr> |
| 2,296<-td> | Completions<-td> | 1,748<-td><-tr> |
| 3,628<-td> | Pass Attempts<-td> | 2,547<-td><-tr> |
| 63.3%<-td> | Completion %<-td> | 68.6%<-td><-tr> |
| 26,434<-td> | Passing Yards<-td> | 19,001<-td><-tr> |
| 195<-td> | Passing Touchdowns<-td> | 140<-td><-tr> |
| 5.4%<-td> | Touchdown Percentage<-td> | 5.5%<-td><-tr> |
| 84<-td> | Interceptions<-td> | 46<-td><-tr> |
| 2.3%<-td> | Interception Percentage<-td> | 1.8%<-td><-tr> |
| 7.3<-td> | Yards Per Pass Attempt<-td> | 7.5<-td><-tr> |
| 7.3<-td> | Adjusted Yards Per Pass Attempt<-td> | 7.7<-td><-tr> |
| 11.5<-td> | Yards Per Completion<-td> | 10.9<-td><-tr> |
| 238.1<-td> | Passing Yards Per Game<-td> | 275.4<-td><-tr> |
| 189<-td> | Times Sacked<-td> | 196<-td><-tr> |
| 5.2%<-td> | Sack Percentage<-td> | 7.7%<-td><-tr><-tr><-tbody><-table>
Josh Allen is a name that has become synonymous with greatness in the NFL. His journey to becoming one of the most talked-about players in the league has been anything but conventional. Born and raised in Firebaugh, California, Allen’s path to success was paved with hard work, determination, and an unwavering commitment to his dreams. Growing up, Allen was always surrounded by athleticism and competition. He was a standout athlete in both basketball and football, even earning an offer to play college basketball at the University of Central Florida. However, it was football that held a special place in his heart, and he ultimately chose to attend Reedley Community College to play as a quarterback. It was at the University of Wyoming where Allen truly began to showcase his immense potential as a quarterback. In his three seasons there, he passed for 5,066 yards and 44 touchdowns, while also adding 1,529 yards and 19 touchdowns on the ground. His performance caught the attention of NFL scouts, and he decided to forgo his senior year to enter the 2018 NFL Draft. Despite being drafted by the Buffalo Bills with the 7th overall pick, Allen’s rookie season was far from easy. He struggled with inconsistency and faced constant criticism from fans and analysts alike. However, he refused to let these challenges break his spirit, and he persevered, determined to prove his doubters wrong. In his second season, Allen finally began to show the world what he was truly capable of. He led the Bills to a 10-6 record and their first playoff appearance in 17 years. He passed for 3,089 yards and 20 touchdowns, while also rushing for an impressive 510 yards and nine touchdowns. His improvement in just one season was nothing short of phenomenal, and it earned him a Pro Bowl nod, solidifying his place among the NFL’s elite quarterbacks. In the 2020 season, Allen continued to build on his success, further refining his skills and cementing his reputation as a top-tier quarterback. He led the Bills to a 13-3 record, the best in franchise history, and was once again selected to the Pro Bowl. He also broke several team records, including passing yards and touchdowns in a single season. With each passing season, Josh Allen continues to silence his critics and solidify his place among the league’s elite quarterbacks. His incredible journey from a small town in California to one of the NFL’s brightest stars is a testament to the power of hard work, determination, and self-belief. As the 2024 season approaches, there is no doubt that Josh Allen will continue to captivate the hearts and minds of football fans across the nation. His unwavering commitment to excellence and his unbridled passion for the game have not only transformed him into a bona fide superstar but have also inspired a new generation of athletes to pursue their dreams with unwavering determination. But beyond the personal accolades and on-field success, Josh Allen’s true impact may lie in the intangibles. His leadership, his resilience, and his ability to overcome adversity serve as a powerful reminder that anything is possible when one believes in themselves and refuses to give up. As the world watches Josh Allen’s meteoric rise in the NFL, it becomes increasingly clear that we are witnessing not just a phenomenal athlete but also a symbol of hope, inspiration, and the indomitable human spirit. For a generation of aspiring athletes and fans alike, Josh Allen’s journey serves as a powerful reminder that with hard work, dedication, and an unwavering belief in oneself, anything is possible. In conclusion, the story of Josh Allen’s rise in the NFL is not just one of a gifted athlete but also a testament to the power of human resilience and the transformative impact of hard work and self-belief. As we eagerly await the next chapter in Allen’s extraordinary journey, it is clear that his legacy will extend far beyond the football field, inspiring countless individuals to pursue their dreams with unwavering determination and passion.  Related Posts
NFL League Minimum: History and Future TrendsThe concept of a league minimum salary in the NFL dates back to the early days of the league. It was established to ensure that all players received a 
NFL Pro Bowl History and EvolutionThe Pro Bowl’s roots can be traced back to 1939 when the first NFL All-Star Game was held. This event featured a matchup between the NFL champion and 
Best NFL Quarterbacks of All-TimeThe quarterback is often considered the most pivotal position in American football. With immense pressure and responsibility, these athletes must exhi 
NFL Honors: Recognizing the League’s Best PlayersEvery year, the NFL Honors ceremony celebrates the finest achievements in professional football. This prestigious event shines a spotlight on the leag 
NFL Playoff History: Memorable MomentsThe NFL playoffs have evolved significantly since the league’s early days, reflecting changes in the sport itself and the growing popularity of profes 
Impact of NFL MVP on Player CareersThe MVP award, bestowed by the Associated Press, is a testament to a player’s exceptional talent, leadership, and influence on the field. Players like 
Strategies for Success in NFL Free AgencyNFL free agency is a period when players who are not under contract can sign with any team. It’s a critical time for teams to strengthen their squads 
How Much Do Scouts Make in the NFL?Before we dive into the specifics of an NFL scout’s salary, it’s essential to understand what exactly these professionals do. NFL scouts are responsib 
What NFL Players Did Martial Arts?The NFL is home to some of the most physically gifted athletes in the world. While football itself is a demanding sport, many NFL players have turned 
How Much is an NFL Pension?Retirement planning is crucial for everyone, including professional athletes. The National Football League (NFL) offers a pension plan to its players, 
How To Become an NFL Referee?Do you dream of being on the field during the biggest football games, making crucial calls, and ensuring fair play? Becoming an NFL referee could be y 
Where is the NFL Hall Of Fame?The Pro Football Hall of Fame, often simply referred to as the NFL Hall of Fame, is a place of reverence for fans of American football. It stands as a 
Who is the Best NFL Team Of All Time?The challenge of naming the best NFL team ever is compounded by the evolution of the game itself. Different eras have emphasized different aspects of 
Did Jim Harbaugh Play In the NFL?When discussing prominent figures in American football, Jim Harbaugh’s name often comes up. Known for his passionate coaching style and strategic acum 
Who Has the Most Interceptions in NFL History?In the electrifying world of football, interceptions stand out as a particularly thrilling aspect of the game. They can dramatically shift momentum, o 
How Many Black Quarterbacks In the NFL?The National Football League (NFL) has a rich history that spans over a century, marked by numerous evolutions and transformations. Throughout this ti 
Which Plays Are Unreviewable In NFL?Before we dive into unreviewable plays, it’s important to understand what constitutes a reviewable play in the NFL. The primary purpose of the review 
What is the Strap Hanging from NFL Players Pants?If you’ve ever watched an NFL game, you might have noticed a curious piece of equipment that many players have hanging from their pants. It’s not unco |