In 111 contests in his career, Allen has connected on 2,296 of his 3,628 attempts for a total of 26,434 yards. He is averaging 238.1 passing yards per game. Allen has thrown 195 TD’s while tossing 84 picks. He’s lost a combined 1,134 yards while being the victim of a quarterback sack 189 times. His touchdown percentage on pass attempts is 5.4% and his interception percentage is 2.3%.
In the 64 contests in his career, Tagovailoa has been successful on 1,387 of his 2,037 attempts for 15,506 yds. He averages 242.3 yards per contest through the air. Tagovailoa has thrown for 100 TD’s while tossing 44 interceptions. He’s been driven back 666 yds while being sacked 111 different times. His touchdown percentage when attempting a pass is 4.9% and his interception percentage is 2.2%.
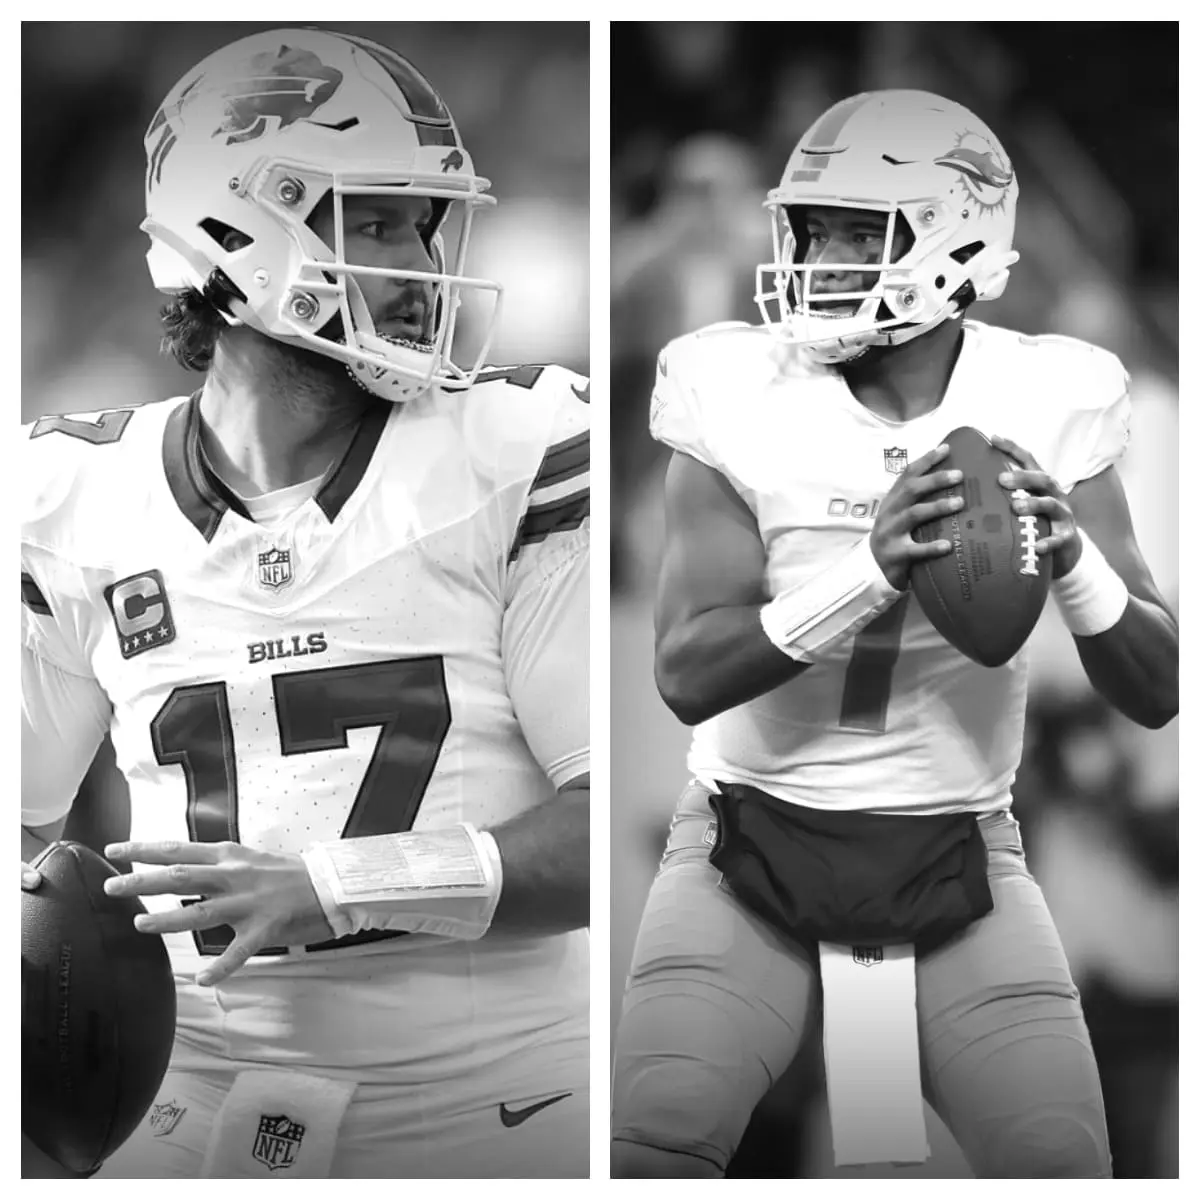
Josh Allen vs Tua Tagovailoa Stats<-h2>
| Josh Allen<-th> | Career<-th> | Tua Tagovailoa<-th><-tr><-thead> |
|---|---|---|
| 111<-td> | Games Played<-td> | 64<-td><-tr> |
| 2,296<-td> | Completions<-td> | 1,387<-td><-tr> |
| 3,628<-td> | Pass Attempts<-td> | 2,037<-td><-tr> |
| 63.3%<-td> | Completion %<-td> | 68.1%<-td><-tr> |
| 26,434<-td> | Passing Yards<-td> | 15,506<-td><-tr> |
| 195<-td> | Passing Touchdowns<-td> | 100<-td><-tr> |
| 5.4%<-td> | Touchdown Percentage<-td> | 4.9%<-td><-tr> |
| 84<-td> | Interceptions<-td> | 44<-td><-tr> |
| 2.3%<-td> | Interception Percentage<-td> | 2.2%<-td><-tr> |
| 7.3<-td> | Yards Per Pass Attempt<-td> | 7.6<-td><-tr> |
| 7.3<-td> | Adjusted Yards Per Pass Attempt<-td> | 7.6<-td><-tr> |
| 11.5<-td> | Yards Per Completion<-td> | 11.2<-td><-tr> |
| 238.1<-td> | Passing Yards Per Game<-td> | 242.3<-td><-tr> |
| 189<-td> | Times Sacked<-td> | 111<-td><-tr> |
| 5.2%<-td> | Sack Percentage<-td> | 5.4%<-td><-tr><-tr><-tbody><-table>
Josh Allen is a name that has become synonymous with greatness in the NFL. His journey to becoming one of the most talked-about players in the league has been anything but conventional. Born and raised in Firebaugh, California, Allen’s path to success was paved with hard work, determination, and an unwavering commitment to his dreams. Growing up, Allen was always surrounded by athleticism and competition. He was a standout athlete in both basketball and football, even earning an offer to play college basketball at the University of Central Florida. However, it was football that held a special place in his heart, and he ultimately chose to attend Reedley Community College to play as a quarterback. It was at the University of Wyoming where Allen truly began to showcase his immense potential as a quarterback. In his three seasons there, he passed for 5,066 yards and 44 touchdowns, while also adding 1,529 yards and 19 touchdowns on the ground. His performance caught the attention of NFL scouts, and he decided to forgo his senior year to enter the 2018 NFL Draft. Despite being drafted by the Buffalo Bills with the 7th overall pick, Allen’s rookie season was far from easy. He struggled with inconsistency and faced constant criticism from fans and analysts alike. However, he refused to let these challenges break his spirit, and he persevered, determined to prove his doubters wrong. In his second season, Allen finally began to show the world what he was truly capable of. He led the Bills to a 10-6 record and their first playoff appearance in 17 years. He passed for 3,089 yards and 20 touchdowns, while also rushing for an impressive 510 yards and nine touchdowns. His improvement in just one season was nothing short of phenomenal, and it earned him a Pro Bowl nod, solidifying his place among the NFL’s elite quarterbacks. In the 2020 season, Allen continued to build on his success, further refining his skills and cementing his reputation as a top-tier quarterback. He led the Bills to a 13-3 record, the best in franchise history, and was once again selected to the Pro Bowl. He also broke several team records, including passing yards and touchdowns in a single season. With each passing season, Josh Allen continues to silence his critics and solidify his place among the league’s elite quarterbacks. His incredible journey from a small town in California to one of the NFL’s brightest stars is a testament to the power of hard work, determination, and self-belief. As the 2024 season approaches, there is no doubt that Josh Allen will continue to captivate the hearts and minds of football fans across the nation. His unwavering commitment to excellence and his unbridled passion for the game have not only transformed him into a bona fide superstar but have also inspired a new generation of athletes to pursue their dreams with unwavering determination. But beyond the personal accolades and on-field success, Josh Allen’s true impact may lie in the intangibles. His leadership, his resilience, and his ability to overcome adversity serve as a powerful reminder that anything is possible when one believes in themselves and refuses to give up. As the world watches Josh Allen’s meteoric rise in the NFL, it becomes increasingly clear that we are witnessing not just a phenomenal athlete but also a symbol of hope, inspiration, and the indomitable human spirit. For a generation of aspiring athletes and fans alike, Josh Allen’s journey serves as a powerful reminder that with hard work, dedication, and an unwavering belief in oneself, anything is possible. In conclusion, the story of Josh Allen’s rise in the NFL is not just one of a gifted athlete but also a testament to the power of human resilience and the transformative impact of hard work and self-belief. As we eagerly await the next chapter in Allen’s extraordinary journey, it is clear that his legacy will extend far beyond the football field, inspiring countless individuals to pursue their dreams with unwavering determination and passion. |