In the 167 contests in his career, McNabb was successful on 3,170 of his 5,374 tries for a total of 37,276 yds. He totaled 223.2 yards per contest through the air. McNabb passed for 234 TD’s compared to 117 interceptions. He lost 2,460 yds while being the victim of a QB sack 410 different times. His touchdown rate when attempting a pass was 4.4% and his interception rate was 2.2%.
In the 143 games in his career, Vick was successful on 1,807 of 3,217 tries for 22,464 yards. He totaled 157.1 yds per contest through the air. Vick passed for 133 TD’s while tossing 88 picks. He was driven back 1,896 yards while being the victim of a QB sack 316 different times. His TD rate when attempting a pass was 4.1% and his interception rate was 2.7%.
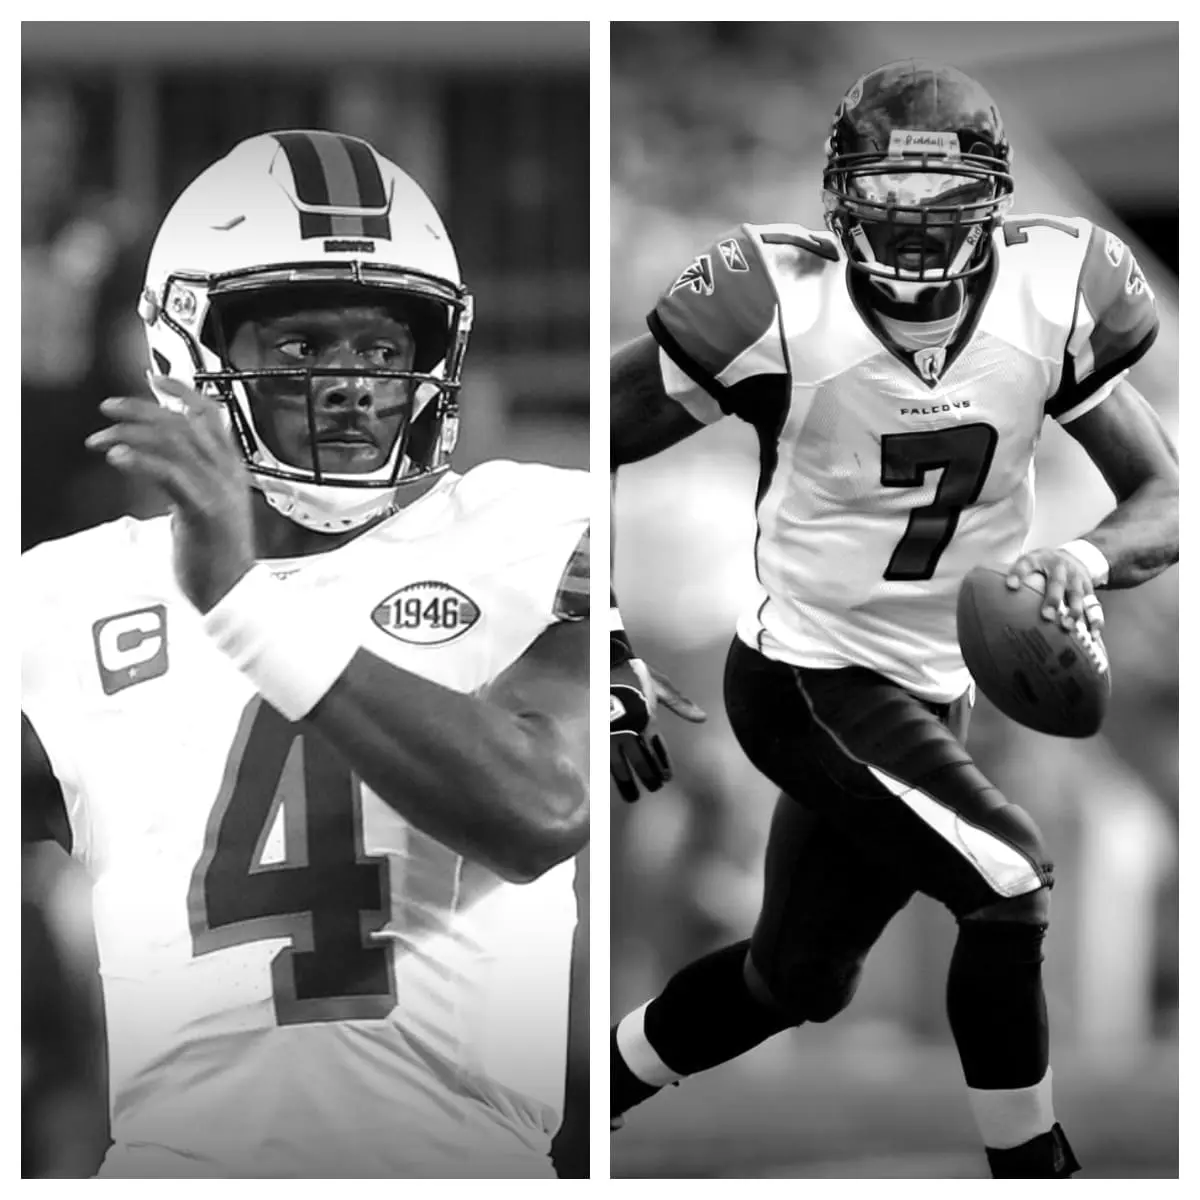
Donovan McNabb vs Michael Vick Stats<-h2>
| Donovan McNabb<-th> | Career<-th> | Michael Vick<-th><-tr><-thead> |
|---|---|---|
| 167<-td> | Games Played<-td> | 143<-td><-tr> |
| 3,170<-td> | Completions<-td> | 1,807<-td><-tr> |
| 5,374<-td> | Pass Attempts<-td> | 3,217<-td><-tr> |
| 59.0%<-td> | Completion %<-td> | 56.2%<-td><-tr> |
| 37,276<-td> | Passing Yards<-td> | 22,464<-td><-tr> |
| 234<-td> | Passing Touchdowns<-td> | 133<-td><-tr> |
| 4.4%<-td> | Touchdown Percentage<-td> | 4.1%<-td><-tr> |
| 117<-td> | Interceptions<-td> | 88<-td><-tr> |
| 2.2%<-td> | Interception Percentage<-td> | 2.7%<-td><-tr> |
| 6.9<-td> | Yards Per Pass Attempt<-td> | 7.0<-td><-tr> |
| 6.8<-td> | Adjusted Yards Per Pass Attempt<-td> | 6.6<-td><-tr> |
| 11.8<-td> | Yards Per Completion<-td> | 12.4<-td><-tr> |
| 223.2<-td> | Passing Yards Per Game<-td> | 157.1<-td><-tr> |
| 410<-td> | Times Sacked<-td> | 316<-td><-tr> |
| 7.6%<-td> | Sack Percentage<-td> | 9.8%<-td><-tr><-tr><-tbody><-table>
Related |