During the 106 contests in his career, Mayfield has been successful on 2,157 of his 3,395 attempts for 24,832 yds. He averages 234.3 yards per contest through the air. Mayfield has thrown 171 touchdowns while giving up 90 picks. He’s been driven back 1,500 yards while being sacked 250 times. His touchdown percentage is 5.0% and his interception percentage is 2.7%.
During the 69 games in his career, Burrow has connected on 1,748 of his 2,547 attempts for 19,001 yards. He is averaging 275.4 yds per game through the air. Burrow has thrown 140 touchdowns compared to 46 picks. He’s been driven back 1,176 yds while being the victim of a QB sack 196 different times. His TD percentage on pass attempts is 5.5% and his interception percentage is 1.8%.
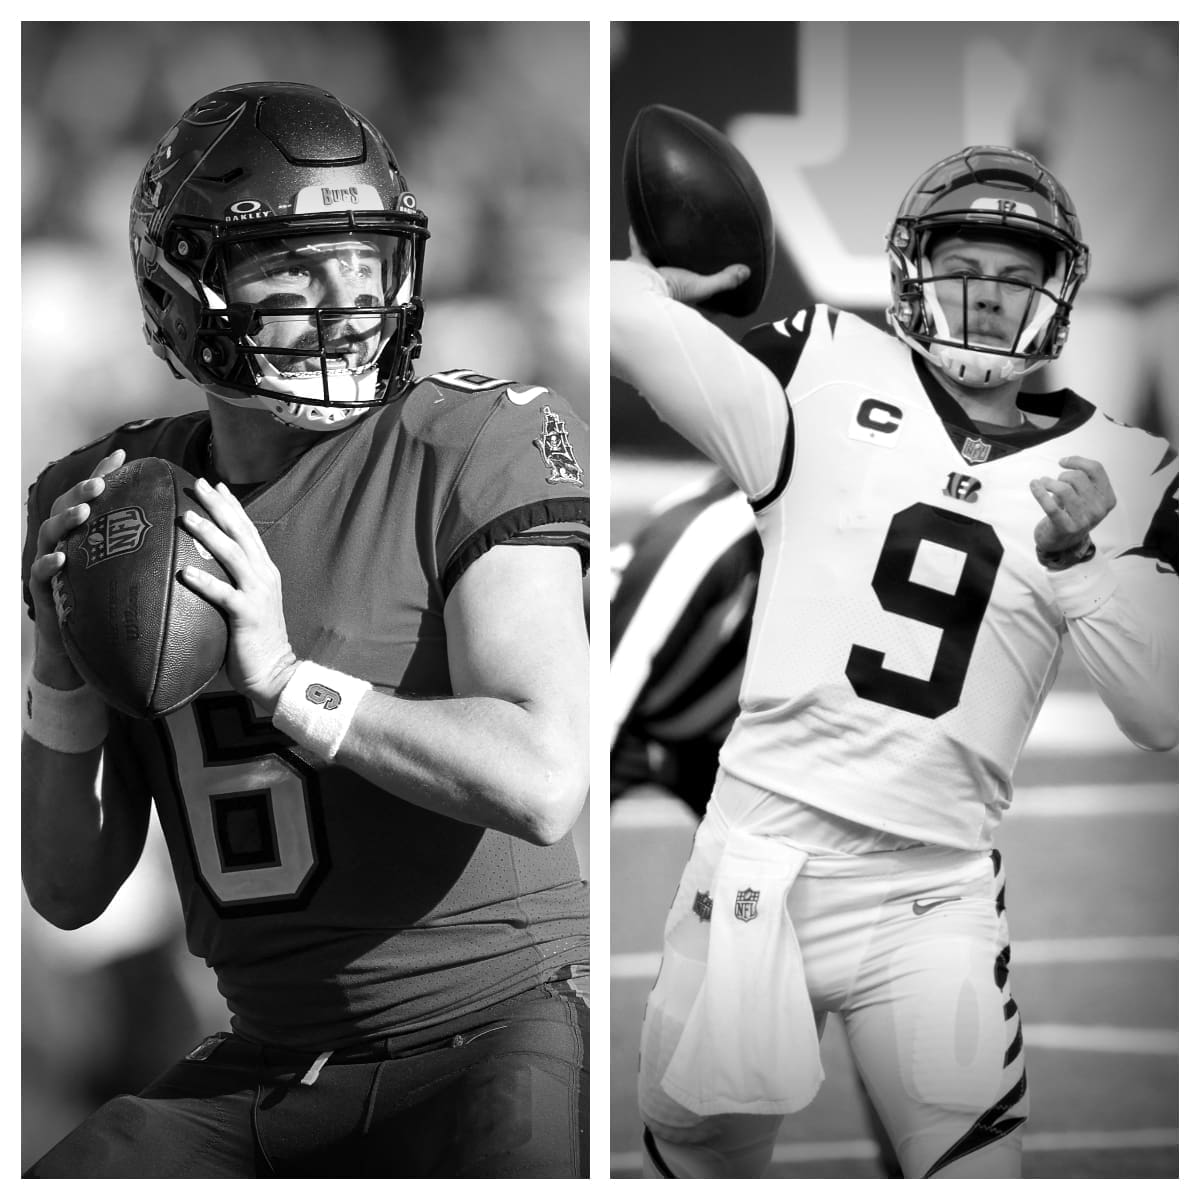
Baker Mayfield vs Joe Burrow Stats<-h2>
| Baker Mayfield<-th> | Career<-th> | Joe Burrow<-th><-tr><-thead> |
|---|---|---|
| 106<-td> | Games Played<-td> | 69<-td><-tr> |
| 2,157<-td> | Completions<-td> | 1,748<-td><-tr> |
| 3,395<-td> | Pass Attempts<-td> | 2,547<-td><-tr> |
| 63.5%<-td> | Completion %<-td> | 68.6%<-td><-tr> |
| 24,832<-td> | Passing Yards<-td> | 19,001<-td><-tr> |
| 171<-td> | Passing Touchdowns<-td> | 140<-td><-tr> |
| 5.0%<-td> | Touchdown Percentage<-td> | 5.5%<-td><-tr> |
| 90<-td> | Interceptions<-td> | 46<-td><-tr> |
| 2.7%<-td> | Interception Percentage<-td> | 1.8%<-td><-tr> |
| 7.3<-td> | Yards Per Pass Attempt<-td> | 7.5<-td><-tr> |
| 7.1<-td> | Adjusted Yards Per Pass Attempt<-td> | 7.7<-td><-tr> |
| 11.5<-td> | Yards Per Completion<-td> | 10.9<-td><-tr> |
| 234.3<-td> | Passing Yards Per Game<-td> | 275.4<-td><-tr> |
| 250<-td> | Times Sacked<-td> | 196<-td><-tr> |
| 7.4%<-td> | Sack Percentage<-td> | 7.7%<-td><-tr><-tr><-tbody><-table>
Throughout the recent years, Baker Mayfield has made a significant impact on the NFL world. Despite facing numerous obstacles and setbacks, Mayfield has proven to be an exceptional leader with the ability to rally his team and deliver outstanding performances on the field. In fact, his resilience and hard work have earned him recognition as the 2018 Heisman Trophy winner. One of the most notable aspects of Mayfield’s career is his ability to manage and motivate his team. With his natural charisma and leadership skills, he has been able to bring the Browns out of a long-standing period of underperformance. Under his guidance, the Browns have experienced an incredible turnaround in recent seasons going from a record of 0-16 just a few years ago, to a playoff-level team expected to continue growing and competing at the highest level. Mayfield’s success is not just limited to his on-field achievements. He also boasts a compelling personality, which makes him a fan favorite both on and off the field. As a young, energetic quarterback, he brings excitement and energy to every game, making it more engaging for both fans and even the team members themselves. Moreover, Mayfield’s dynamic playing style and decision-making skills have allowed him to excel in various aspects of the game. He is not bound to any one playstyle and is adaptable to different systems and play calls. This flexibility has been critical in helping him develop into a well-rounded player with the potential to become one of the greatest quarterbacks in the NFL. It is evident that Baker Mayfield’s presence has changed the landscape of the NFL. His strong work ethic and leadership skills have been crucial in the Browns’ resurgence and have established him as a formidable force both on and off the field. His exciting playing style, combined with his engaging personality, makes him a role model for aspiring young athletes. With the Browns on the rise and Mayfield continuing to excel, it is clear that his career is on a trajectory to greatness. As an innovative and inspiring NFL player, Baker Mayfield has revolutionized the game and set a new standard for excellence. His commitment to hard work, dedication to his teammates, and exceptional leadership qualities have earned him a well-deserved reputation as a difference-maker both on and off the field. It is evident that Mayfield’s impact on the NFL goes beyond just being a talented quarterback he has become a symbol of hope, resilience, and success, inspiring young athletes and fans alike with his impressive achievements and unwavering spirit. One of the defining qualities of Mayfield’s career is his passion for the game, which is evident in every play he makes. Despite facing numerous challenges and setbacks, he has never allowed these obstacles to deter him from his goals. Instead, Mayfield has always approached these challenges as opportunities to grow and become a better player. His determination, resilience, and self-motivation have made him a role model for others, inspiring them to push past their limits and achieve their goals. Moreover, Mayfield’s genuine love for the game has also made him an incredibly engaging presence on the field. His dynamic playing style, combined with his infectious enthusiasm, has captivated audiences and made him a fan favorite. This admiration and support have been essential in fueling Mayfield’s desire to improve and succeed, pushing him to consistently outperform expectations and create unforgettable moments in the NFL. In conclusion, Baker Mayfield’s impact on the NFL is undeniable. His incredible work ethic, exceptional leadership qualities, and unwavering passion for the game have made him an icon, both on and off the field. With his continued success and growth, Mayfield has set a new standard for excellence in the NFL, inspiring future generations of players and fans alike. It is clear that his journey is just beginning, and we can only look forward to witnessing the incredible opportunities and achievements that await him in the years to come. |