When it comes to per game stats, Robinson averages 2.5 assists in addition to 10.6 boards. He has 1,388 steals, as well as 2,954 blocks and 2,441 dimes. Sitting with 7,414 defensive boards and 3,083 on the offensive end of the court, Robinson has recorded 10,497 boards in total during his pro basketball career. Sitting with an effective field goal percentage of 51.9%, he has also garnered 2,835 fouls and 2,417 turnovers. Robinson has made 6,035 out of his 8,201 attempts from the free throw line, giving him a rate of 73.6%. By burying 7,340 of 14,121 2pt attempts, he has earned a rate of 52.0%. By making 25 of 100 shots from 3-point range, he has recorded a three-point shooting percentage of 25.0%. By converting 7,365 shots out of 14,221 attempts, Robinson has accumulated a 51.8% shooting percentage. He accounts for 21.8 pts per 36 minutes, in addition to snagging 11.0 boards and racking up 2.6 assists in his pro basketball career. Robinson was named a starter in 985 matchups, and in those matchups he averages 21.1 points per contest and has amassed 20,790 points overall. David Robinson has participated in 987 contests so far in his NBA career and accounted for 34,271 minutes in those games.

- THE ADMIRAL DREAM TEAM PLUSH FIGURE – Bleacher Creatures stand on their own, are great for social media pics and perfect for play.
- QUALITY CONSTRUCTION AND DETAIL – Crafted to transform your heroes into plush toys with personality – for fun that lasts.
- KEY PRODUCT SPECS – 10” tall, with screen printed details just like the Dream Team wore on the court in Barcelona.
- OFFICIALLY LICENSED – This is officially licensed by the NBA and USA Basketball.
- MAKES A GREAT PRESENT – The perfect keepsake for any fan, young or old, of the David Robinson. A great addition to any USA Basketball fan’s collection.

- PREMIUM VINYL MATERIAL - Made from high-quality, durable vinyl, this collectible is built to last and withstand daily wear, ensuring long-lasting enjoyment for fans and collectors alike
- LEADING POP CULTURE BRAND - Trust in the expertise of Funko, the premier creator of pop culture merchandise that includes vinyl figures, action toys, plush, apparel, board games, and more
- EXPAND YOUR COLLECTION - Add this unique MICHAEL JORDAN vinyl display piece to your growing assortment of Funko Pop! figures, and seek out other rare and exclusive collectible items for a complete set
- PERFECT GIFT FOR NBA LEGENDS FANS - Ideal for holidays, birthdays, or special occasions and as a present this exclusive figurine is a must-have addition to any NBA Legends merchandise collection
In relation to helping on baskets, Jordan has tallied 5,633 dimes, as well as getting 2,514 steals and 893 blocks. He is averaging 6.2 rebounds and 0.0 assists per contest. He has earned 6,672 total rebounds during his NBA career by grabbing 5,004 on the defensive end and 1,668 offensive. With an eFG% of 50.9%, he has also accounted for 2,924 turnovers and has a total of 2,783 infractions. Jordan has amassed a 83.5% rate from the foul line by making 7,327 out of 8,772 shot attempts. He has amassed a 51.0% two-point shooting percentage of by converting 11,611 of 22,759 attempts. Having shot 1,778 three point tries during his NBA career, he has accrued a 3PT rate of 32.7% by converting 581 of those shots. With a shooting percentage of 49.7%, Jordan has knocked down 12,192 baskets of his 24,537 attempts. He records 4.9 assists, grabs 5.9 boards and accumulates 28.3 per 36 minutes. Jordan has tallied 32,292 points during his NBA career, holds an average of 30.1 points per contest and has started in 1,039 games. Michael Jordan has compiled 41,011 minutes and has participated in 1,072 contests in his NBA career.
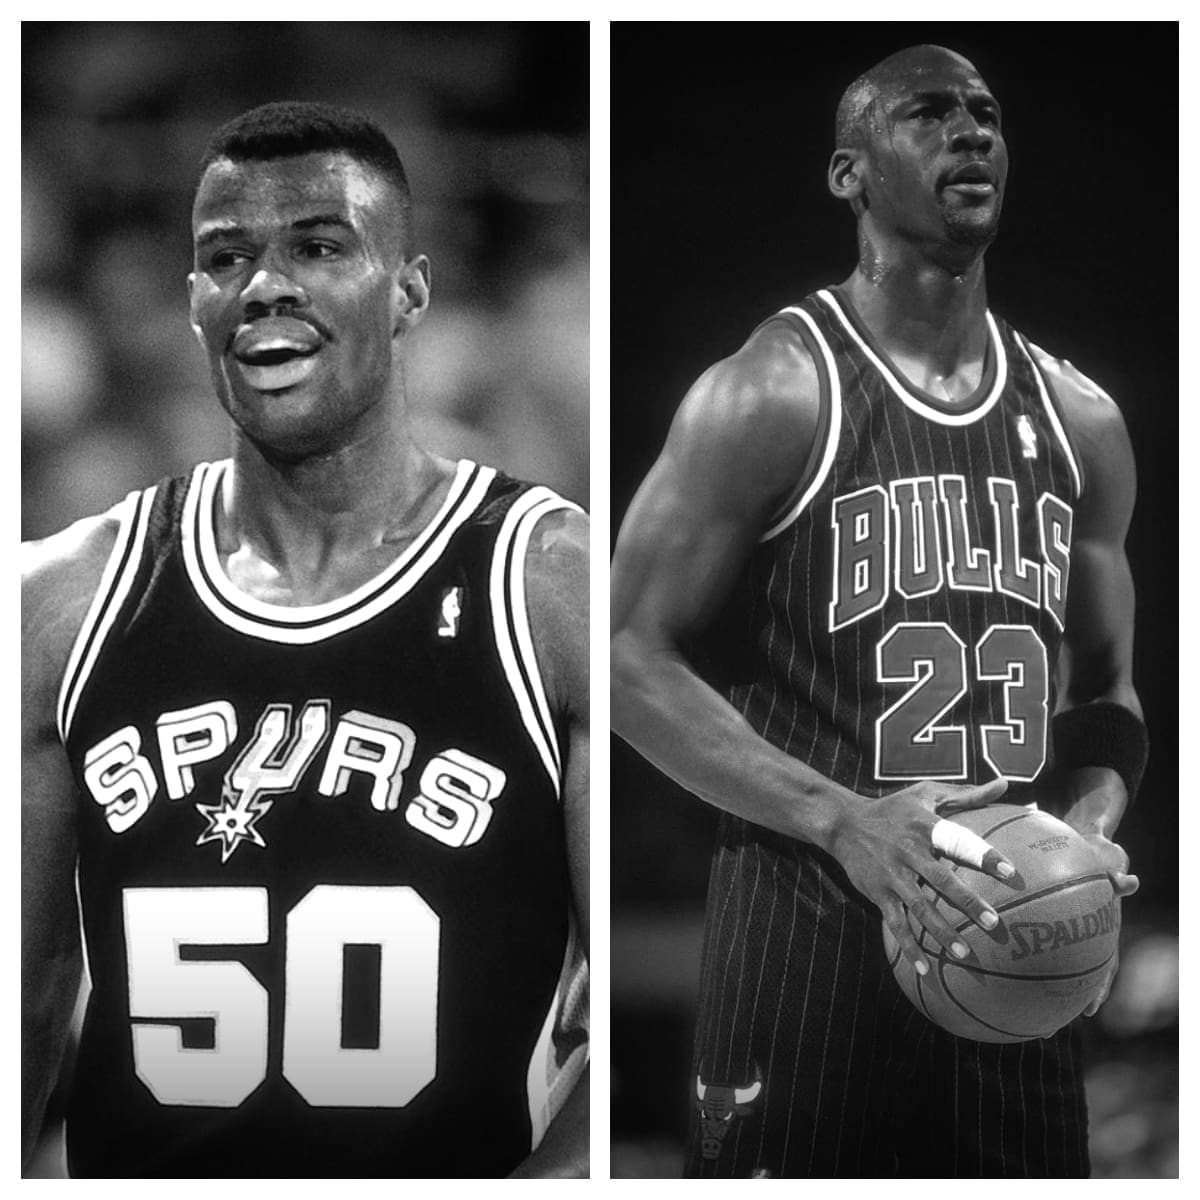
David Robinson vs Michael Jordan Stats
| David Robinson | Career | Michael Jordan |
|---|---|---|
| 987 | Games Played | 1,072 |
| 985 | Games Started | 1,039 |
| 34,271 | Minutes Played | 41,011 |
| 7,365 | Field Goals Made | 12,192 |
| 14,221 | Field Goals Attempted | 24,537 |
| 51.8% | Field Goal Percentage | 49.7% |
| 25 | 3-Pointers Made | 581 |
| 100 | 3-Pointers Attempted | 1,778 |
| 25.0% | 3-Point Percentage | 32.7% |
| 7,340 | 2-Pointers Made | 11,611 |
| 14,121 | 2-Pointers Attempted | 22,759 |
| 52.0% | 2-Point Percentage | 51.0% |
| 51.9% | eFG% | 50.9% |
| 6,035 | Free Throws Made | 7,327 |
| 8,201 | Free Throws Attempted | 8,772 |
| 73.6% | Free Throw Percentage | 83.5% |
| 3,083 | Offensive Rebounds | 1,668 |
| 7,414 | Defensive Rebounds | 5,004 |
| 10,497 | Total Rebounds | 6,672 |
| 2,441 | Assists | 5,633 |
| 1,388 | Steals | 2,514 |
| 2,954 | Blocks | 893 |
| 2,417 | Turnovers | 2,924 |
| 2,835 | Personal Fouls | 2,783 |
| 20,790 | Points Scored | 32,292 |
| 21.1 | Points Per Game | 30.1 |
| 34.7 | Minutes Per Game | 38.3 |
| 2.5 | Assists Per Game | 5.3 |
| 10.6 | Rebounds Per Game | 6.2 |
| 21.8 | Points Per 36 Minutes | 28.3 |
| 11.0 | Rebounds Per 36 Minutes | 5.9 |
| 2.6 | Assists Per 36 Minutes | 4.9 |