Jimmy Butler has participated in 907 contests in his NBA career and compiled 29,972 minutes in those contests. Butler was named a starter in 802 games, and in those games he is averaging 18.4 points/G and has accumulated 16,658 points in all. He tallies 20.0 points per 36 mins, in addition to pulling down 5.8 rebounds and collecting 4.8 assists so far in his pro basketball career. By burying 5,387 baskets out of 11,371 attempts, Butler has tallied a 47.4% field goal percentage. By making 716 out of his 2,169 shots from three-point range, he has accumulated a three-point shooting percentage of 33.0%. By converting 4,671 out of 9,202 2pt shots, he has recorded an average of 50.8%. Butler has buried 5,168 out of 6,120 shot attempts from the charity stripe, which gave him a clip of 84.4%. Holding an effective FG percentage of 50.5%, he has also amassed 1,242 personal fouls and 1,459 turnovers. Having collected 3,329 defensive rebounds and 1,529 on the offensive end, Butler has recorded 4,858 rebounds in total during his career. He has accumulated 1,455 steals, in addition to 387 blocks and 3,957 dimes. Concerning per game stats, Butler sports an average of 4.4 dimes in addition to 5.4 rebounds.
Paul George has accumulated 31,651 mins and has stepped onto the hardwood in 945 contests so far in his NBA career. George has accumulated 19,338 pts in his career, averages 20.5 points/G and started 897 matchups. He records 4.0 assists, pulls in 6.7 boards and racks up 22.0 per 36 minutes. With a FG% of 44.0%, George has made 6,625 shots out of 15,066 attempts. With 6,382 3PT attempts so far in his pro basketball career, he has accumulated a shooting percentage of 38.4% by making 2,449 of those shots. He has recorded a 48.1% shooting percentage of by making 4,176 out of 8,684 tries. George has amassed a 85.2% percentage at the free throw line by making 3,639 out of 4,271 shot attempts. Sitting with an effective FG rate of 52.1%, he has additionally recorded 2,487 turnovers and committed 2,502 personal fouls. He is sitting with 5,880 rebounds in total in his NBA career by pulling down 5,110 defensive and 770 of the offensive sort. When talking about sharing the basketball, George has earned 3,502 assists, as well as getting 1,601 steals and 417 blocks. He is averaging 6.2 rebounds and 3.7 dimes per game.
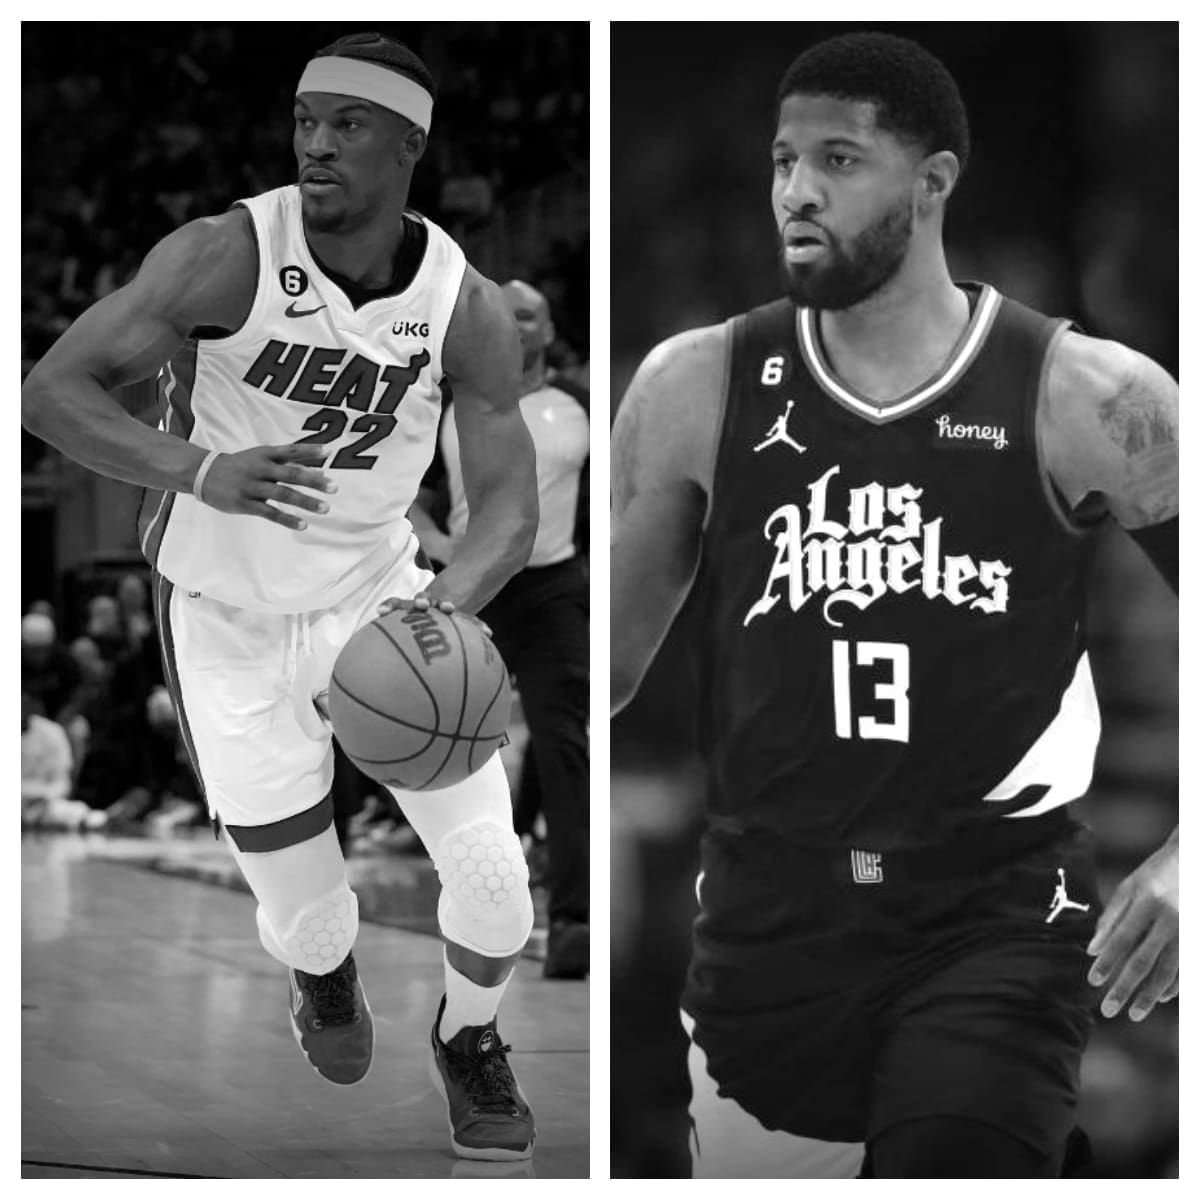
Jimmy Butler vs Paul George Stats
| Jimmy Butler | Career | Paul George |
|---|---|---|
| 907 | Games Played | 945 |
| 802 | Games Started | 897 |
| 29,972 | Minutes Played | 31,651 |
| 5,387 | Field Goals Made | 6,625 |
| 11,371 | Field Goals Attempted | 15,066 |
| 47.4% | Field Goal Percentage | 44.0% |
| 716 | 3-Pointers Made | 2,449 |
| 2,169 | 3-Pointers Attempted | 6,382 |
| 33.0% | 3-Point Percentage | 38.4% |
| 4,671 | 2-Pointers Made | 4,176 |
| 9,202 | 2-Pointers Attempted | 8,684 |
| 50.8% | 2-Point Percentage | 48.1% |
| 50.5% | eFG% | 52.1% |
| 5,168 | Free Throws Made | 3,639 |
| 6,120 | Free Throws Attempted | 4,271 |
| 84.4% | Free Throw Percentage | 85.2% |
| 1,529 | Offensive Rebounds | 770 |
| 3,329 | Defensive Rebounds | 5,110 |
| 4,858 | Total Rebounds | 5,880 |
| 3,957 | Assists | 3,502 |
| 1,455 | Steals | 1,601 |
| 387 | Blocks | 417 |
| 1,459 | Turnovers | 2,487 |
| 1,242 | Personal Fouls | 2,502 |
| 16,658 | Points Scored | 19,338 |
| 18.4 | Points Per Game | 20.5 |
| 33.0 | Minutes Per Game | 33.5 |
| 4.4 | Assists Per Game | 3.7 |
| 5.4 | Rebounds Per Game | 6.2 |
| 20.0 | Points Per 36 Minutes | 22.0 |
| 5.8 | Rebounds Per 36 Minutes | 6.7 |
| 4.8 | Assists Per 36 Minutes | 4.0 |