Magic Johnson has played in 906 contests thus far in his career and is sitting with 33,245 minutes in those games. Johnson was named a starter in 763 matchups, and in those matchups he averages 19.5 points per game and has accounted for 17,707 points. He racks up 19.2 points per 36 minutes, in addition to snagging 7.1 rebounds and recording 11.0 assists during his pro basketball career. By converting 6,211 baskets out of his 11,951 attempts, Johnson has compiled a 52.0% shot %. By converting 325 of his 1,074 shots from long range, he has recorded a 3pt rate of 30.3%. By converting 5,886 of 10,877 2pt shot attempts, he has accumulated a rate of 54.1%. Johnson has knocked down 4,960 out of his 5,850 shots at the foul line, giving him a clip of 84.8%. Having earned an effective field goal rate of 53.3%, he has also amassed 2,050 fouls and 3,506 turnovers. Having grabbed 4,958 defensive boards and 1,601 on the offensive end, Johnson has recorded 6,559 total boards in his pro basketball career. He has accounted for 1,724 steals, as well as 374 rejections and 10,141 assists. When it comes to stats per game, Johnson averages 11.2 assists as well as 7.2 rebounds.
When talking about making his teammates better, Jordan has 5,633 assists, in addition to supplying 2,514 steals and 893 blocks. He has an average of 6.2 rebounds in addition to 0.0 dimes per contest. He has compiled 6,672 total boards in his career by pulling down 5,004 on the defensive side of the court and 1,668 offensive. Stepping onto the court with an effective FG percentage of 50.9%, he has additionally accounted for 2,924 turnovers and committed 2,783 personal fouls. Jordan has compiled a 83.5% clip from the free throw line by knocking down 7,327 of his 8,772 shots. He has accounted for a 51.0% two-point shooting percentage of by way of knocking down 11,611 of 22,759 shots. With 1,778 three point attempts during his pro basketball career, he has recorded a shooting percentage of 32.7% by knocking down 581 of those shots. Stepping onto the court with a shooting % of 49.7%, Jordan has knocked down 12,192 baskets of his 24,537 attempts. He dishes out 4.9 dimes, collects 5.9 rebounds and scores 28.3 per 36 minutes. Jordan has tallied 32,292 pts in his NBA career, comes in with an average of 30.1 PPG and got the starting nod in 1,039 contests. Michael Jordan has accounted for 41,011 minutes and has stepped onto the hardwood in 1,072 contests in his pro basketball career.
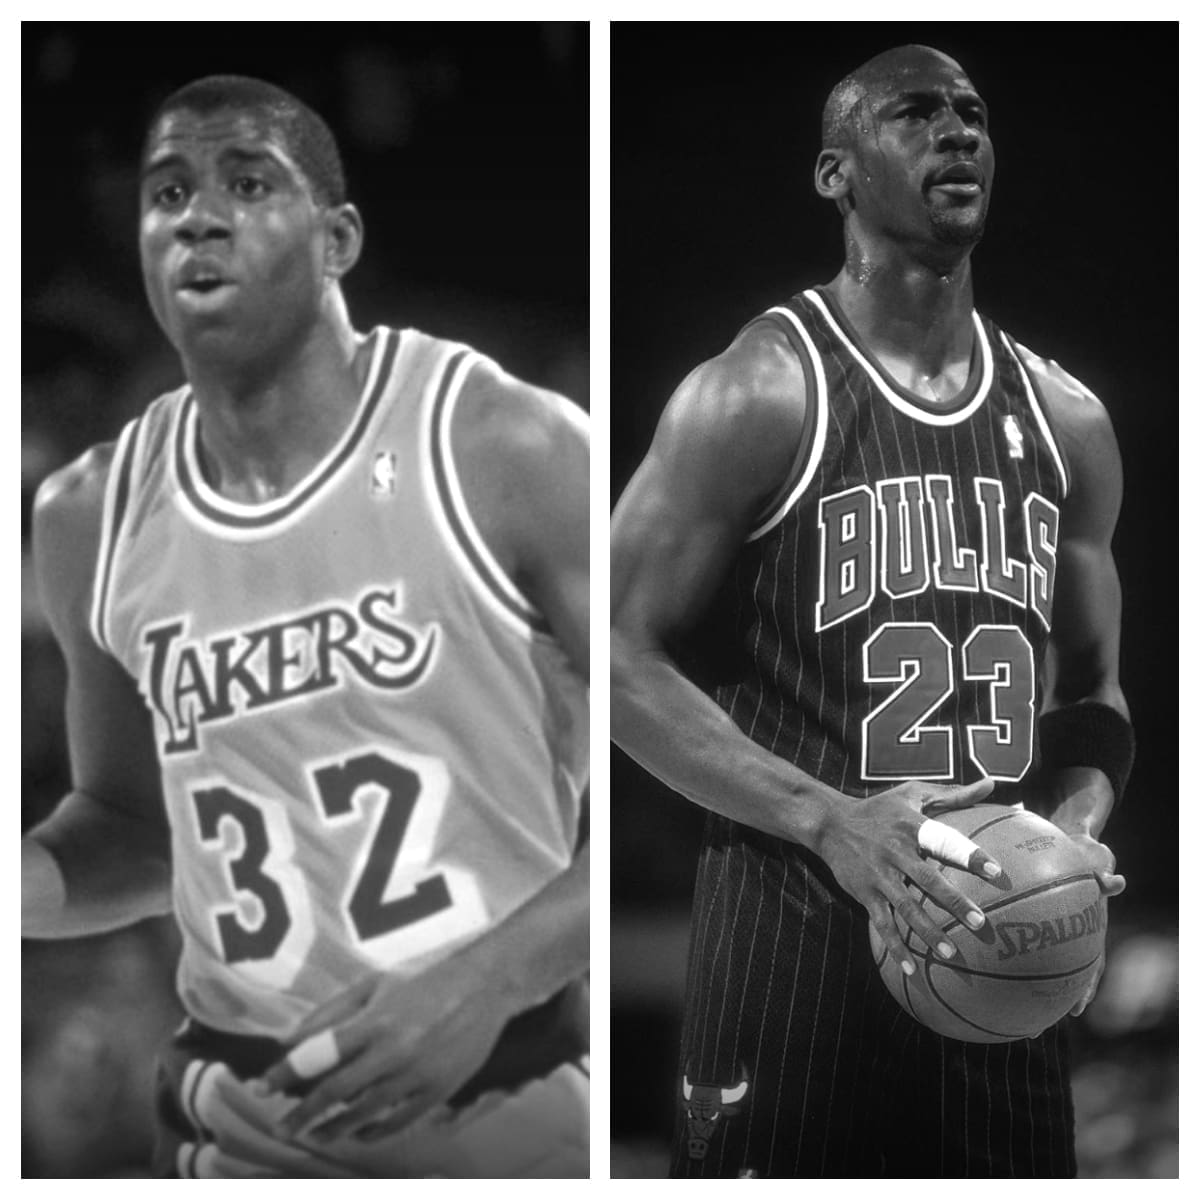
Magic Johnson vs Michael Jordan Stats
| Magic Johnson | Career | Michael Jordan |
|---|---|---|
| 906 | Games Played | 1,072 |
| 763 | Games Started | 1,039 |
| 33,245 | Minutes Played | 41,011 |
| 6,211 | Field Goals Made | 12,192 |
| 11,951 | Field Goals Attempted | 24,537 |
| 52.0% | Field Goal Percentage | 49.7% |
| 325 | 3-Pointers Made | 581 |
| 1,074 | 3-Pointers Attempted | 1,778 |
| 30.3% | 3-Point Percentage | 32.7% |
| 5,886 | 2-Pointers Made | 11,611 |
| 10,877 | 2-Pointers Attempted | 22,759 |
| 54.1% | 2-Point Percentage | 51.0% |
| 53.3% | eFG% | 50.9% |
| 4,960 | Free Throws Made | 7,327 |
| 5,850 | Free Throws Attempted | 8,772 |
| 84.8% | Free Throw Percentage | 83.5% |
| 1,601 | Offensive Rebounds | 1,668 |
| 4,958 | Defensive Rebounds | 5,004 |
| 6,559 | Total Rebounds | 6,672 |
| 10,141 | Assists | 5,633 |
| 1,724 | Steals | 2,514 |
| 374 | Blocks | 893 |
| 3,506 | Turnovers | 2,924 |
| 2,050 | Personal Fouls | 2,783 |
| 17,707 | Points Scored | 32,292 |
| 19.5 | Points Per Game | 30.1 |
| 36.7 | Minutes Per Game | 38.3 |
| 11.2 | Assists Per Game | 5.3 |
| 7.2 | Rebounds Per Game | 6.2 |
| 19.2 | Points Per 36 Minutes | 28.3 |
| 7.1 | Rebounds Per 36 Minutes | 5.9 |
| 11.0 | Assists Per 36 Minutes | 4.9 |