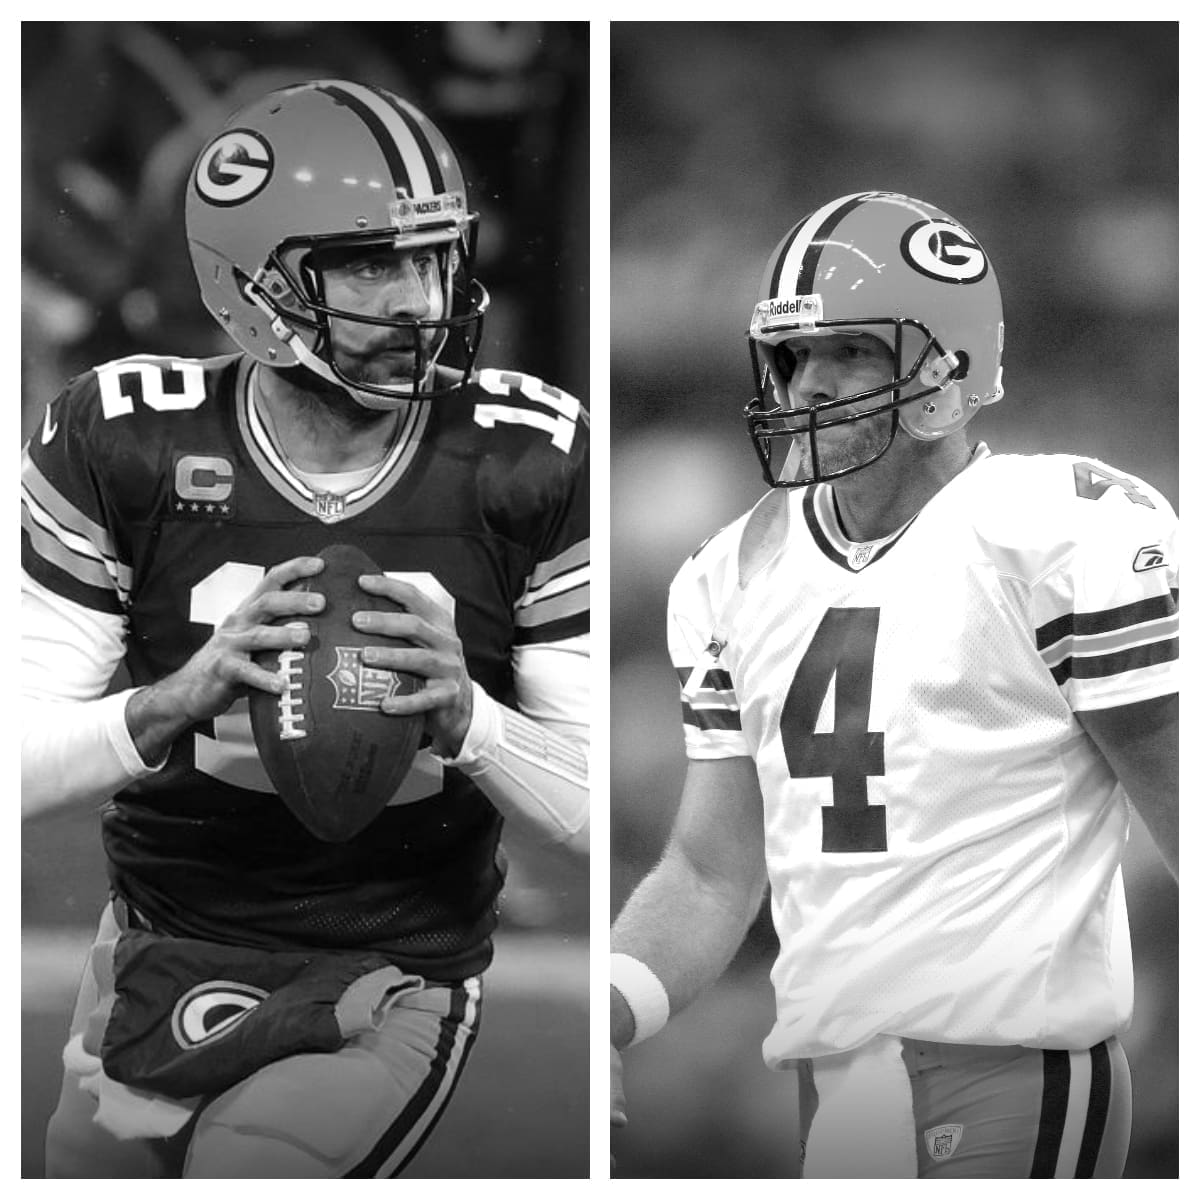
During the 248 contests in his career, Rodgers has completed 5,369 of his 8,245 tries for a total of 62,952 yards. He averages 253.8 passing yards per game. Rodgers has thrown for 503 TD’s while tossing 116 picks. He’s lost a total of 3,426 yards while being the victim of a QB sack 571 times. His touchdown percentage on pass attempts is 6.1% and his interception percentage is 1.4%.
In 302 contests in his career, Favre connected on 6,300 of his 10,169 tries for a total of 71,838 yds. He accumulated 237.9 yds per game through the air. Favre threw for 508 touchdowns compared to 336 picks. He lost 3,150 yards while being sacked 525 times. His touchdown percentage on pass attempts was 5.0% and his interception percentage was 3.3%.
Aaron Rodgers vs Brett Favre Stats<-h2>
| Aaron Rodgers<-th> | Career<-th> | Brett Favre<-th><-tr><-thead> |
|---|---|---|
| 248<-td> | Games Played<-td> | 302<-td><-tr> |
| 5,369<-td> | Completions<-td> | 6,300<-td><-tr> |
| 8,245<-td> | Pass Attempts<-td> | 10,169<-td><-tr> |
| 65.1%<-td> | Completion %<-td> | 62.0%<-td><-tr> |
| 62,952<-td> | Passing Yards<-td> | 71,838<-td><-tr> |
| 503<-td> | Passing Touchdowns<-td> | 508<-td><-tr> |
| 6.1%<-td> | Touchdown Percentage<-td> | 5.0%<-td><-tr> |
| 116<-td> | Interceptions<-td> | 336<-td><-tr> |
| 1.4%<-td> | Interception Percentage<-td> | 3.3%<-td><-tr> |
| 7.6<-td> | Yards Per Pass Attempt<-td> | 7.1<-td><-tr> |
| 8.2<-td> | Adjusted Yards Per Pass Attempt<-td> | 6.6<-td><-tr> |
| 11.7<-td> | Yards Per Completion<-td> | 11.4<-td><-tr> |
| 253.8<-td> | Passing Yards Per Game<-td> | 237.9<-td><-tr> |
| 571<-td> | Times Sacked<-td> | 525<-td><-tr> |
| 6.9%<-td> | Sack Percentage<-td> | 5.2%<-td><-tr><-tr><-tbody><-table>
Aaron Rodgers has established a remarkable legacy in the National Football League. This exceptional quarterback for the Green Bay Packers is a true icon who has earned numerous accolades throughout his illustrious career. Rodgers’ legacy is built on strong leadership, exceptional skill, and unparalleled success both on and off the field. Rodgers’ journey to success began when he was selected by the Packers in the first round of the 2005 NFL Draft. As an understudy to then-starting quarterback Brett Favre, Rodgers patiently honed his skills before taking over the reins in 2008. Once he stepped into the spotlight, Rodgers quickly displayed the talent and leadership needed to lead his team to victory. In his first full season as a starting quarterback, Aaron Rodgers led the Packers to a 11-4 record, earning a spot in the playoffs as the NFC North champions. He continued to excel in his subsequent seasons, consistently guiding his team to a winning record and playoff appearances. Rodgers’ outstanding play earned him recognition from the NFL community, including a much-deserved MVP award in 2011, a season in which he set numerous records, including the highest single-season passer rating. In 2010, Rodgers’ career reached new heights when he led the Packers to a Super Bowl victory, defeating the Pittsburgh Steelers in Super Bowl XLV. Rodgers’ performance in the game earned him the Super Bowl MVP award, solidifying his status as a top quarterback in the league. Rodgers’ impact on the Packers has been nothing short of extraordinary. He holds an extensive number of franchise records, including career passing yards, touchdowns, and completion percentage. Furthermore, his exceptional leadership has inspired countless teammates and earned the respect and admiration of football fans worldwide. Beyond his achievements with the Packers, Aaron Rodgers has also had a significant impact on the NFL as a whole. He is widely regarded as one of the most skilled and efficient quarterbacks in the history of the league, and his innovative play style has inspired future generations of quarterbacks. His intelligence, athleticism, and ability to read defenses have made him a perennial favorite among both fans and analysts alike. As a result, Rodgers has become synonymous with success in the NFL and has helped elevate the Packers to perennial contenders. In summary, Aaron Rodgers has built an enduring legacy in the NFL with a combination of leadership, skill, and an exceptional dedication to excellence. As he continues to dazzle fans and break records, it is clear that his legacy will continue to grow, ensuring that his name will forever be synonymous with the However, Rodgers’ story goes beyond his remarkable achievements on the field. Off the field, he has also made a significant impact through his philanthropy and charitable endeavors. Rodgers is a steadfast supporter of many charitable organizations, using his fame and influence to raise awareness and funds for various causes. One such cause is the MACC Fund, a charity close to Rodgers’ heart. The MACC Fund supports childhood cancer research and works tirelessly to improve treatment options for young patients and their families. Rodgers has been an active supporter of the MACC Fund for many years, often visiting hospitals and attending charity events to promote its mission. Rodgers’ dedication to philanthropic causes is not limited to just the MACC Fund; he also supports numerous other charities, such as Wisconsin’s Miracles Consortium, a coalition of Wisconsin hospitals supporting children and families in need, as well as various education-focused organizations. Off the field, Rodgers shares his time with friends and family. He is known to be an avid golfer, often participating in charity golf events during the off-season. His love for the sport is such that he sometimes participates in PGA Tour events, showcasing his skills and passion beyond the football field. Rodgers is also a talented musician, playing the piano and guitar. In fact, his musical talents are sometimes showcased during Packers games, as he is known to occasionally perform the national anthem for his team. In conclusion, Aaron Rodgers’ legacy in the NFL and beyond extends far beyond his on-field accomplishments. Through his exceptional career, philanthropy, and dedication to making a difference in his community, Rodgers has truly solidified his status as a legend not just in the world of football but also in the hearts of people everywhere. As he continues to inspire future generations of athletes and make a positive impact on the world, it is clear that Aaron Rodgers’ legacy will live on for years to come. In his 16 years with the Packers, Aaron Rodgers has compiled a stunning list of accomplishments. He has been named the NFL MVP four times, which ties him for the most MVP awards in NFL history. He has also been selected to the Pro Bowl nine times, further emphasizing his consistency and dominance on the field. Rodgers is the Packers’ all-time leader in passing yards, completions, and touchdowns. His career passer rating of 103. 3 is not only the highest in NFL history but also over five full points higher than the second-place passer, Steve Young. This remarkable statistic Related Posts
NFL League Minimum: History and Future TrendsThe concept of a league minimum salary in the NFL dates back to the early days of the league. It was established to ensure that all players received a 
NFL Pro Bowl History and EvolutionThe Pro Bowl’s roots can be traced back to 1939 when the first NFL All-Star Game was held. This event featured a matchup between the NFL champion and 
Best NFL Quarterbacks of All-TimeThe quarterback is often considered the most pivotal position in American football. With immense pressure and responsibility, these athletes must exhi 
NFL Honors: Recognizing the League’s Best PlayersEvery year, the NFL Honors ceremony celebrates the finest achievements in professional football. This prestigious event shines a spotlight on the leag 
NFL Playoff History: Memorable MomentsThe NFL playoffs have evolved significantly since the league’s early days, reflecting changes in the sport itself and the growing popularity of profes 
Impact of NFL MVP on Player CareersThe MVP award, bestowed by the Associated Press, is a testament to a player’s exceptional talent, leadership, and influence on the field. Players like 
Strategies for Success in NFL Free AgencyNFL free agency is a period when players who are not under contract can sign with any team. It’s a critical time for teams to strengthen their squads 
How Much Do Scouts Make in the NFL?Before we dive into the specifics of an NFL scout’s salary, it’s essential to understand what exactly these professionals do. NFL scouts are responsib 
What NFL Players Did Martial Arts?The NFL is home to some of the most physically gifted athletes in the world. While football itself is a demanding sport, many NFL players have turned 
How Much is an NFL Pension?Retirement planning is crucial for everyone, including professional athletes. The National Football League (NFL) offers a pension plan to its players, 
How To Become an NFL Referee?Do you dream of being on the field during the biggest football games, making crucial calls, and ensuring fair play? Becoming an NFL referee could be y 
Where is the NFL Hall Of Fame?The Pro Football Hall of Fame, often simply referred to as the NFL Hall of Fame, is a place of reverence for fans of American football. It stands as a 
Who is the Best NFL Team Of All Time?The challenge of naming the best NFL team ever is compounded by the evolution of the game itself. Different eras have emphasized different aspects of 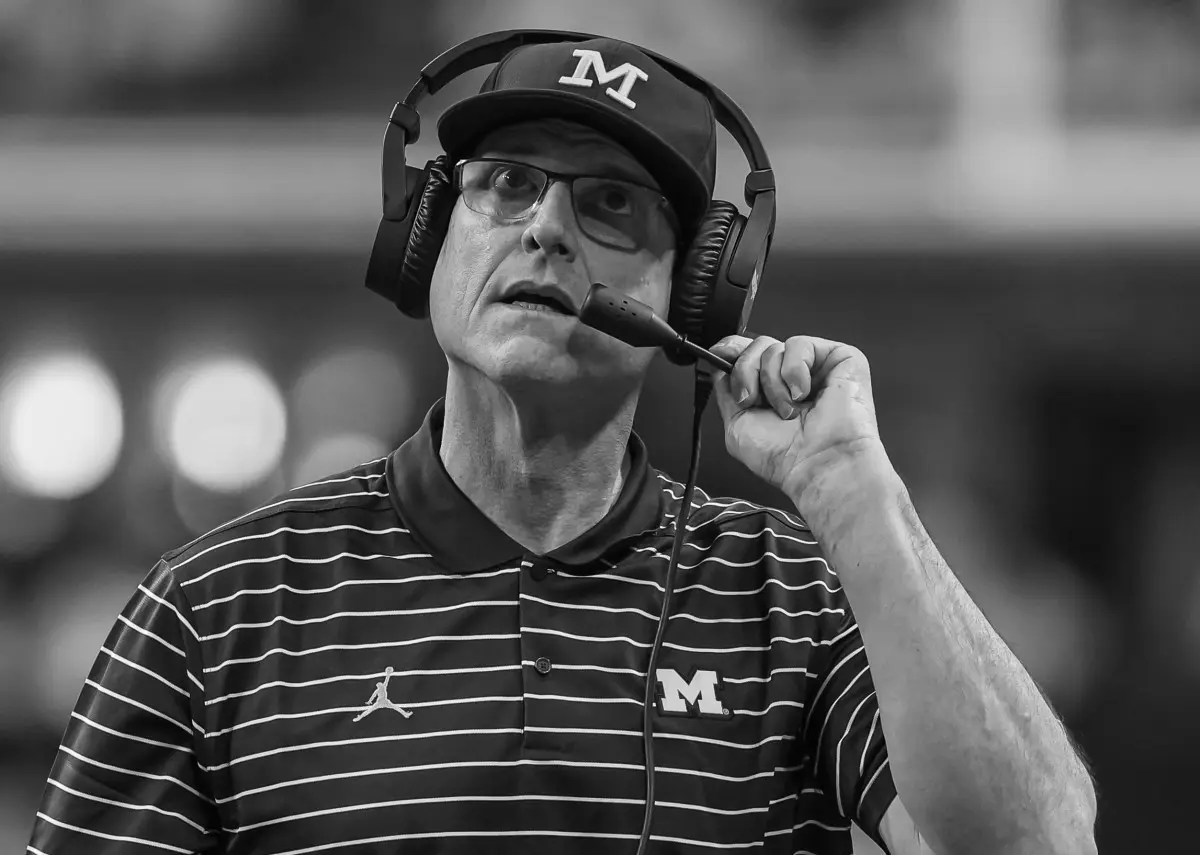
Did Jim Harbaugh Play In the NFL?When discussing prominent figures in American football, Jim Harbaugh’s name often comes up. Known for his passionate coaching style and strategic acum 
Who Has the Most Interceptions in NFL History?In the electrifying world of football, interceptions stand out as a particularly thrilling aspect of the game. They can dramatically shift momentum, o 
How Many Black Quarterbacks In the NFL?The National Football League (NFL) has a rich history that spans over a century, marked by numerous evolutions and transformations. Throughout this ti 
Which Plays Are Unreviewable In NFL?Before we dive into unreviewable plays, it’s important to understand what constitutes a reviewable play in the NFL. The primary purpose of the review 
What is the Strap Hanging from NFL Players Pants?If you’ve ever watched an NFL game, you might have noticed a curious piece of equipment that many players have hanging from their pants. It’s not unco |