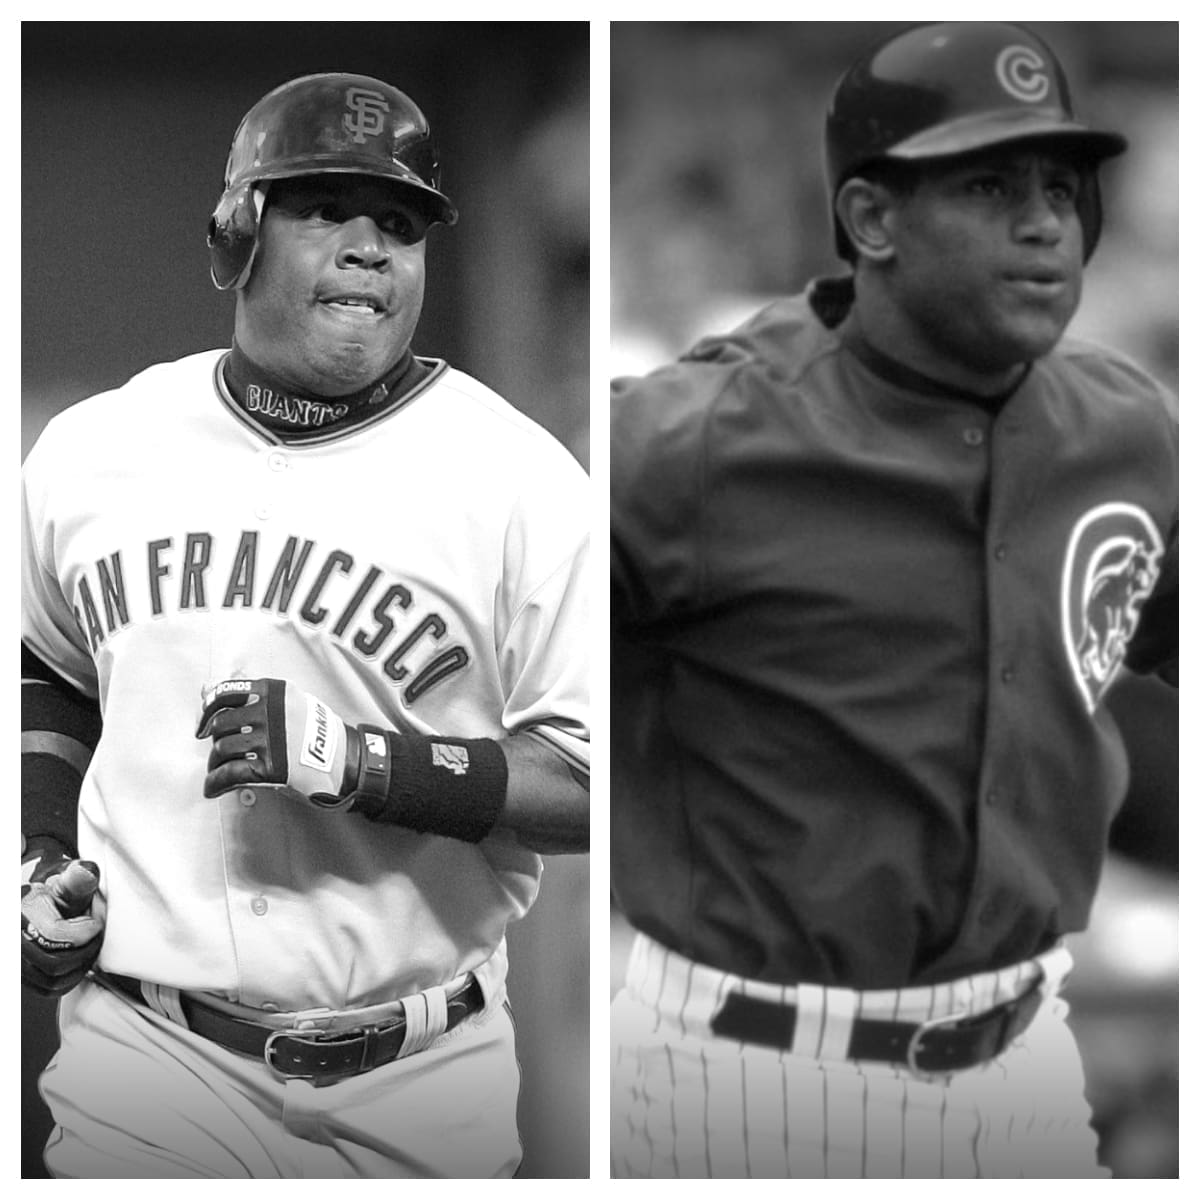
Bonds has raked .298 for his baseball career in addition to 2,227 runs scored and an OPS of .311. For his career, he stepped into the batters box 12,606 times and has come through with a base knock 2,935 times. His slugging percentage is -.133 and he has a total of 5,976 bases. For his pro baseball career, Bonds has hit 762 balls out of the park while knocking in 1,996 runs. He has fanned 1,539 times and earned a walk on 2,558 occasions, which contributes in part to a .444 OBP.
For the 8,813 at-bats in his professional career, Sosa is sitting with a batting average of .273 with 2,408 hits. His on-base percentage is .344 and he has a career OPS of .270. He is sitting with 1,475 runs in addition to having earned 1,667 RBIs. Sosa has tallied a free base 929 times while fanning on 2,306 tries. He has hit the long ball 609 times, with 4,704 total bases and also a -.073 slugging percentage.
| Barry Bonds | Career | Sammy Sosa |
|---|---|---|
| 2,986 | Games Played | 2,354 |
| 12,606 | Plate Appearances | 9,896 |
| 9,847 | At-Bats | 8,813 |
| 2,227 | Runs | 1,475 |
| 2,935 | Hits | 2,408 |
| 601 | Doubles | 379 |
| 77 | Triples | 45 |
| 762 | Home Runs | 609 |
| 1,996 | Runs Batted In | 1,667 |
| 514 | Stolen Bases | 234 |
| 141 | Caught Stealing | 107 |
| 2,558 | Walks | 929 |
| 1,539 | Strikeouts | 2,306 |
| .298 | Batting Average | .273 |
| .444 | On-Base Percentage | .344 |
| -.133 | Slugging Percentage | -.073 |
| 0.311 | OPS | 0.270 |
| 5,976 | Total Bases | 4,704 |
| 165 | Grounded Into Double Plays | 202 |
| 106 | Hit By Pitch | 59 |