Gibson (251-174 0) holds a 2.91 earned run average while surrendering 7.6 hits per 9 innings. His strikeout to walk ratio is 2.33 and he has faced 16,068 opposing hitters so far in his career. So far in his MLB career, Gibson has given up 3,279 hits while earning 3,117 K’s in 3,884 innings pitched. He has conceded 1,258 earned runs while earning a WHIP of 1.188 and a FIP of 2.9.
Koufax (165-87 0) is the owner of a 2.76 earned run average 0 6.8 hits per nine innings. He has a K/BB ratio of 2.93 and he has gone up against 9,497 hitters in his MLB career. During his career, Koufax has conceded 1,754 base hits and he has 2,396 strikeouts in 2,324 innings pitched. He has given up 713 earned runs while holding a WHIP of 1.106 and having a FIP of 2.7.
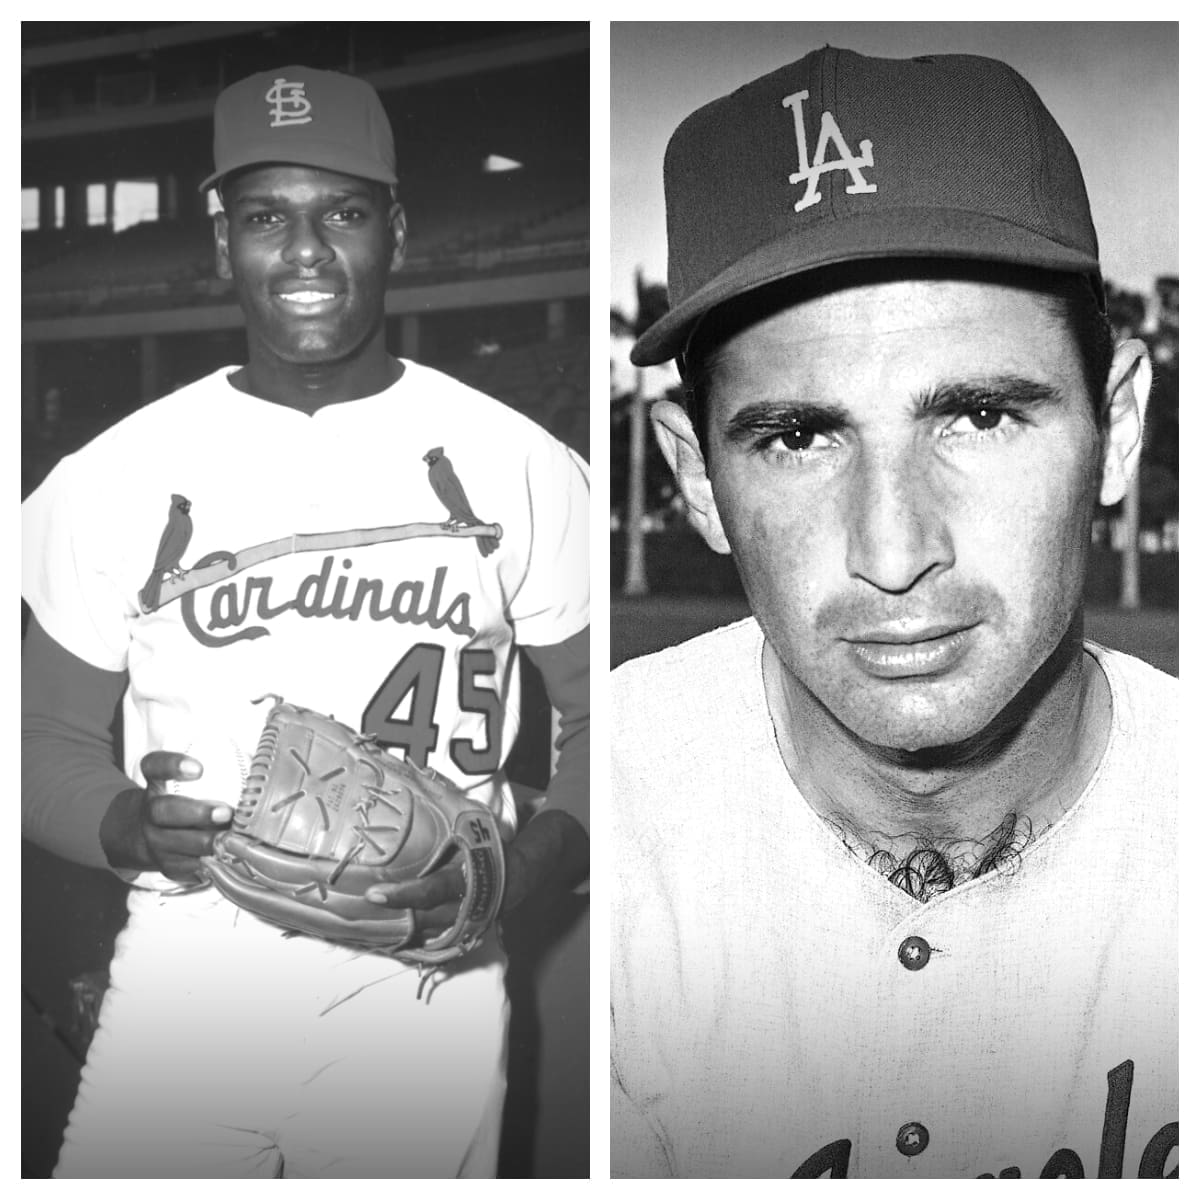
Bob Gibson vs Sandy Koufax Stats
| Bob Gibson | Stat | Sandy Koufax |
|---|---|---|
| 251 | Wins | 165 |
| 174 | Losses | 87 |
| 0.591 | W-L% | 0.655 |
| 2.91 | Earned Run Average (ERA) | 2.76 |
| 528 | Games Played | 397 |
| 482 | Games Started | 314 |
| 1.188 | WHIP | 1.106 |
| 2.33 | Strikeout to Walk Ratio (SO/W) | 2.93 |
| 7.6 | Hits Allowed Per 9 Innings | 6.8 |
| 6 | Saves | 9 |
| 3,884 | Innings Pitched | 2,324 |
| 3,279 | Hits Allowed | 1,754 |
| 1,420 | Runs Allowed | 806 |
| 1,258 | Earned Runs Allowed | 713 |
| 257 | Home Runs Allowed | 204 |
| 1,336 | Walks | 817 |
| 118 | Intentional Walks | 48 |
| 3,117 | Strikeouts | 2,396 |
| 16,068 | Batters Faced | 9,497 |
| 7.2 | Strikeouts Per 9 Innings | 9.3 |
| 2.89 | Fielding Independent Pitching (FIP) | 2.69 |