Newton passed for 194 touchdowns compared to 123 picks. His TD percentage when attempting a pass was 4.3% and his interception rate was 2.7%. He lost 1,992 yds while being the victim of a quarterback sack 332 times. He finished with 218.8 passing yards per game. In the 148 contests in his career, Newton connected on 2,682 of his 4,474 tries for 32,382 yds.
In the 111 contests in his career, Allen has completed 2,296 of his 3,628 tries for 26,434 yds. He is averaging 238.1 passing yards per game. Allen has thrown 195 touchdowns while giving up 84 picks. He’s lost a total of 1,134 yards while being the victim of a QB sack 189 different times. His touchdown percentage is 5.4% and his interception percentage is 2.3%.
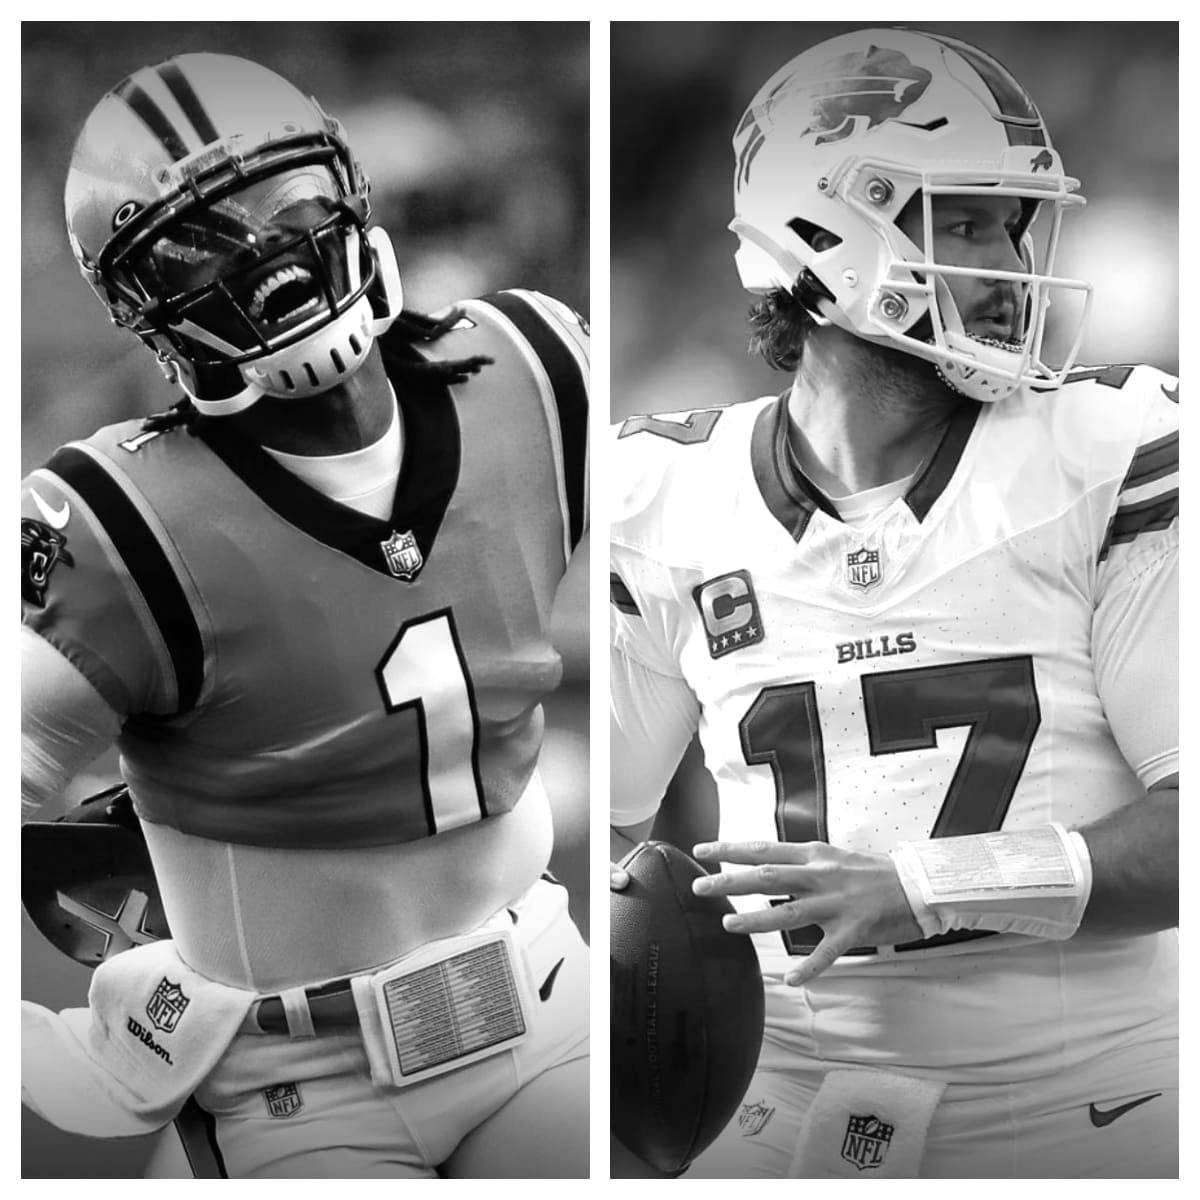
Cam Newton vs Josh Allen Stats<-h2>
| Cam Newton<-th> | Career<-th> | Josh Allen<-th><-tr><-thead> |
|---|---|---|
| 148<-td> | Games Played<-td> | 111<-td><-tr> |
| 2,682<-td> | Completions<-td> | 2,296<-td><-tr> |
| 4,474<-td> | Pass Attempts<-td> | 3,628<-td><-tr> |
| 59.9%<-td> | Completion %<-td> | 63.3%<-td><-tr> |
| 32,382<-td> | Passing Yards<-td> | 26,434<-td><-tr> |
| 194<-td> | Passing Touchdowns<-td> | 195<-td><-tr> |
| 4.3%<-td> | Touchdown Percentage<-td> | 5.4%<-td><-tr> |
| 123<-td> | Interceptions<-td> | 84<-td><-tr> |
| 2.7%<-td> | Interception Percentage<-td> | 2.3%<-td><-tr> |
| 7.2<-td> | Yards Per Pass Attempt<-td> | 7.3<-td><-tr> |
| 6.9<-td> | Adjusted Yards Per Pass Attempt<-td> | 7.3<-td><-tr> |
| 12.1<-td> | Yards Per Completion<-td> | 11.5<-td><-tr> |
| 218.8<-td> | Passing Yards Per Game<-td> | 238.1<-td><-tr> |
| 332<-td> | Times Sacked<-td> | 189<-td><-tr> |
| 7.4%<-td> | Sack Percentage<-td> | 5.2%<-td><-tr><-tr><-tbody><-table>
Cameron Jerrell Newton, the 6’5″, 245-pound quarterback, has been electrifying the NFL since his debut in 2011. Born on May 11, 1989, in Atlanta, Georgia, Cam hails from a family deeply rooted in sports. His father Cecil played in the NFL and was trained by former Denver Broncos coach Red Miller, which explains how young Cam was drawn to football at the age of five. Cam’s college years were quite a rollercoaster – first playing for the University of Florida, then transferring to Blinn College in Texas, and finally ending up at Auburn University. It was at Auburn where he excelled, taking the LS Him for the national title. In 2010, Newton would become only the second player in the BCS era to score in the 2000/200 Club, meaning he amassed 2000 passing yards and 20 rushing touchdowns in a single season. After guiding Auburn to a national championship, Cam was taken as the first overall pick in the 2011 NFL Draft by the Carolina Panthers. This marked the beginning of his extraordinary career. In his early years with the Panthers, Cam was a force to reckon with. He established several records, becoming the first rookie to throw for 4,000 yards and the first quarterback ever to throw for 4,000 yards and 400 rushing yards in a single season. In 2015, Newton would lead Cam Him to a 15-1 record, the best regular season record in franchise history, and their first Super Bowl appearance. Cam capped off the season by winning the NFL MVP award. Newton’s athleticism, combined with his size and raw power, made him unlike any quarterback drafted in the modern era. Standing six feet, five inches tall and weighing 245 pounds, it was almost impossible for opposing defenses to bring Cam down. He was a threat both in the air and on the ground, making him virtually unstoppable at times. However, every story has a turning point, and Cam’s was no different. Between 2016 and 2019, he was sidelined by injuries, including surgeries on his throwing shoulder and foot. Despite these setbacks, he returned to the starting lineup in 2020. Cam also faced criticism over his love for the spotlight, with many accusing him of being a ‘me’ player, rather than a ‘we team first’ one. But Cam brushed aside the criticism, choosing instead to focus on his craft and work harder than ever. After nine years with the Panthers, Cam was released in March 2020. He signed a one-year deal with the New England Patriots soon after. Many doubted whether he could still perform at the elite level he once did, given his injuries and age. But Cam proved his doubters wrong. He led the Patriots to a 7-9 record, the best in the AFC East, and secured a playoff spot. Even at 32, Cam has shown no signs of slowing down. He continues to develop his passing game while remaining a threat on the ground. He’s also become a mentor to younger players on the team, proving that he’s much more than a sports superstar; he’s a leader. The incredible story of Cam Newton is the epitome of resilience and hard work. Despite facing numerous challenges throughout his career, Cam has never shied away from the spotlight. His highs may have been met with lows, but through it all, he has remained true to himself and his craft. As fans, we’ve been treated to some of the most electrifying plays in NFL history thanks to Cam. His unique blend of size, speed, and agility has changed the quarterback position forever. Regardless of whether he’s playing or not, Cam Newton has made an indelible mark on the sport we love. He’s more than just a quarterback – he’s a legend in the making. So next time you watch Cam Newton play, remember his journey – from a boy who played football in the backyard with his father, to becoming a college sensation, to the highs of NFL success, to the lows of injury and doubt, and eventually to his renaissance as a leader and an elite player. Cam Newton’s story is one of perseverance, determination, and most importantly, love for the game. It’s a story that will surely inspire generations to come. Rise Up, Cam Newton! [https://www. sportingnews. com/nfl/news/cam-newton-stats-patriots-press-conference-performance-recap-flacco-injury-week-1-17/1ymcx9hr45h6gsmmieuouso] [https://www. usatoday. com/story Related Posts
NFL League Minimum: History and Future TrendsThe concept of a league minimum salary in the NFL dates back to the early days of the league. It was established to ensure that all players received a 
NFL Pro Bowl History and EvolutionThe Pro Bowl’s roots can be traced back to 1939 when the first NFL All-Star Game was held. This event featured a matchup between the NFL champion and 
Best NFL Quarterbacks of All-TimeThe quarterback is often considered the most pivotal position in American football. With immense pressure and responsibility, these athletes must exhi 
NFL Honors: Recognizing the League’s Best PlayersEvery year, the NFL Honors ceremony celebrates the finest achievements in professional football. This prestigious event shines a spotlight on the leag 
NFL Playoff History: Memorable MomentsThe NFL playoffs have evolved significantly since the league’s early days, reflecting changes in the sport itself and the growing popularity of profes 
Impact of NFL MVP on Player CareersThe MVP award, bestowed by the Associated Press, is a testament to a player’s exceptional talent, leadership, and influence on the field. Players like 
Strategies for Success in NFL Free AgencyNFL free agency is a period when players who are not under contract can sign with any team. It’s a critical time for teams to strengthen their squads 
How Much Do Scouts Make in the NFL?Before we dive into the specifics of an NFL scout’s salary, it’s essential to understand what exactly these professionals do. NFL scouts are responsib 
What NFL Players Did Martial Arts?The NFL is home to some of the most physically gifted athletes in the world. While football itself is a demanding sport, many NFL players have turned 
How Much is an NFL Pension?Retirement planning is crucial for everyone, including professional athletes. The National Football League (NFL) offers a pension plan to its players, 
How To Become an NFL Referee?Do you dream of being on the field during the biggest football games, making crucial calls, and ensuring fair play? Becoming an NFL referee could be y 
Where is the NFL Hall Of Fame?The Pro Football Hall of Fame, often simply referred to as the NFL Hall of Fame, is a place of reverence for fans of American football. It stands as a 
Who is the Best NFL Team Of All Time?The challenge of naming the best NFL team ever is compounded by the evolution of the game itself. Different eras have emphasized different aspects of 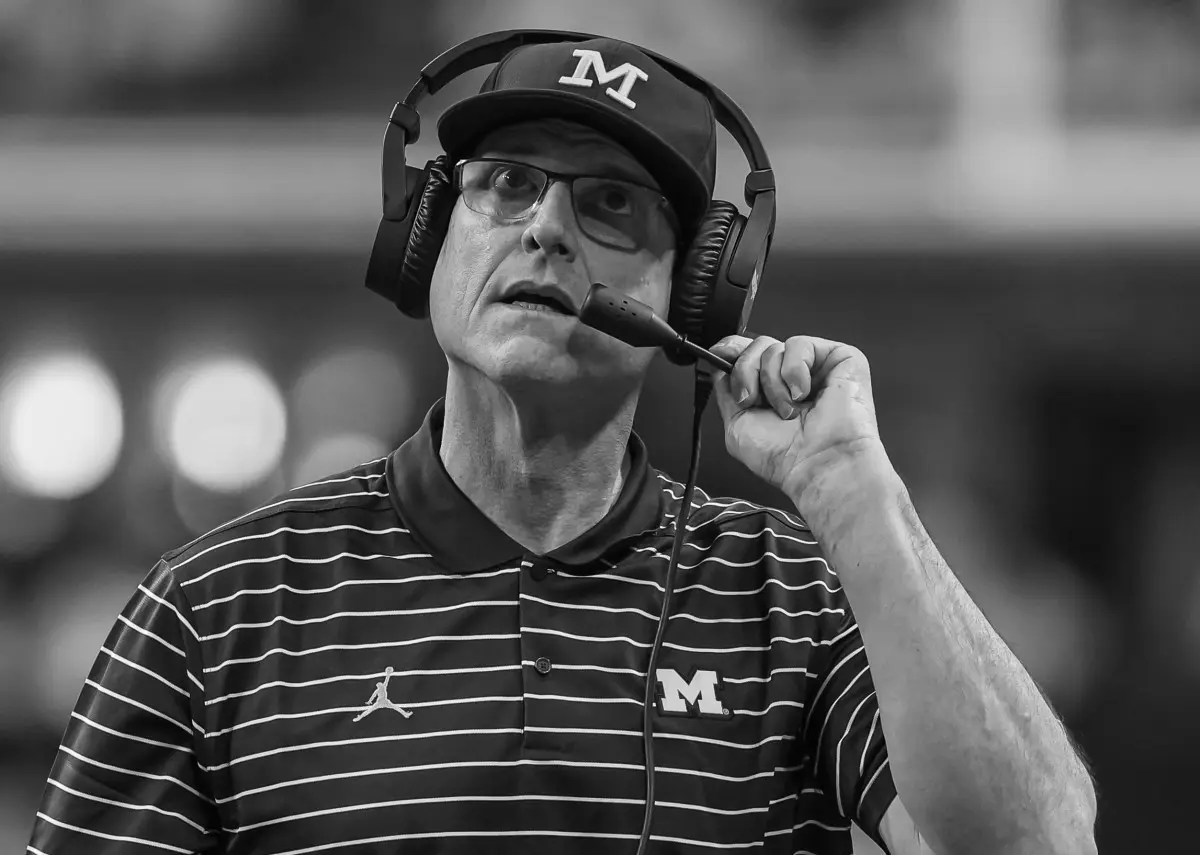
Did Jim Harbaugh Play In the NFL?When discussing prominent figures in American football, Jim Harbaugh’s name often comes up. Known for his passionate coaching style and strategic acum 
Who Has the Most Interceptions in NFL History?In the electrifying world of football, interceptions stand out as a particularly thrilling aspect of the game. They can dramatically shift momentum, o 
How Many Black Quarterbacks In the NFL?The National Football League (NFL) has a rich history that spans over a century, marked by numerous evolutions and transformations. Throughout this ti 
Which Plays Are Unreviewable In NFL?Before we dive into unreviewable plays, it’s important to understand what constitutes a reviewable play in the NFL. The primary purpose of the review 
What is the Strap Hanging from NFL Players Pants?If you’ve ever watched an NFL game, you might have noticed a curious piece of equipment that many players have hanging from their pants. It’s not unco |