McNabb passed for 234 touchdowns while tossing 117 picks. His TD rate on pass attempts was 4.4% and his interception rate was 2.2%. He lost a combined 2,460 yards while being sacked 410 different times. He totaled 223.2 yds per contest through the air. In the 167 games in his career, McNabb was successful on 3,170 of 5,374 attempts for 37,276 yds.
During the 161 contests in his career, Cunningham completed 2,429 of 4,289 tries for 29,979 yards. He averaged 186.2 yards per game through the air. Cunningham passed for 207 TD’s compared to 134 interceptions. He lost 2,904 yds while being the victim of a quarterback sack 484 times. His touchdown percentage was 4.8% and his interception rate was 3.1%.
Donovan McNabb vs Randall Cunningham Stats<-h2>
| Donovan McNabb<-th> | Career<-th> | Randall Cunningham<-th><-tr><-thead> |
|---|---|---|
| 167<-td> | Games Played<-td> | 161<-td><-tr> |
| 3,170<-td> | Completions<-td> | 2,429<-td><-tr> |
| 5,374<-td> | Pass Attempts<-td> | 4,289<-td><-tr> |
| 59.0%<-td> | Completion %<-td> | 56.6%<-td><-tr> |
| 37,276<-td> | Passing Yards<-td> | 29,979<-td><-tr> |
| 234<-td> | Passing Touchdowns<-td> | 207<-td><-tr> |
| 4.4%<-td> | Touchdown Percentage<-td> | 4.8%<-td><-tr> |
| 117<-td> | Interceptions<-td> | 134<-td><-tr> |
| 2.2%<-td> | Interception Percentage<-td> | 3.1%<-td><-tr> |
| 6.9<-td> | Yards Per Pass Attempt<-td> | 7.0<-td><-tr> |
| 6.8<-td> | Adjusted Yards Per Pass Attempt<-td> | 6.5<-td><-tr> |
| 11.8<-td> | Yards Per Completion<-td> | 12.3<-td><-tr> |
| 223.2<-td> | Passing Yards Per Game<-td> | 186.2<-td><-tr> |
| 410<-td> | Times Sacked<-td> | 484<-td><-tr> |
| 7.6%<-td> | Sack Percentage<-td> | 11.3%<-td><-tr><-tr><-tbody><-table>
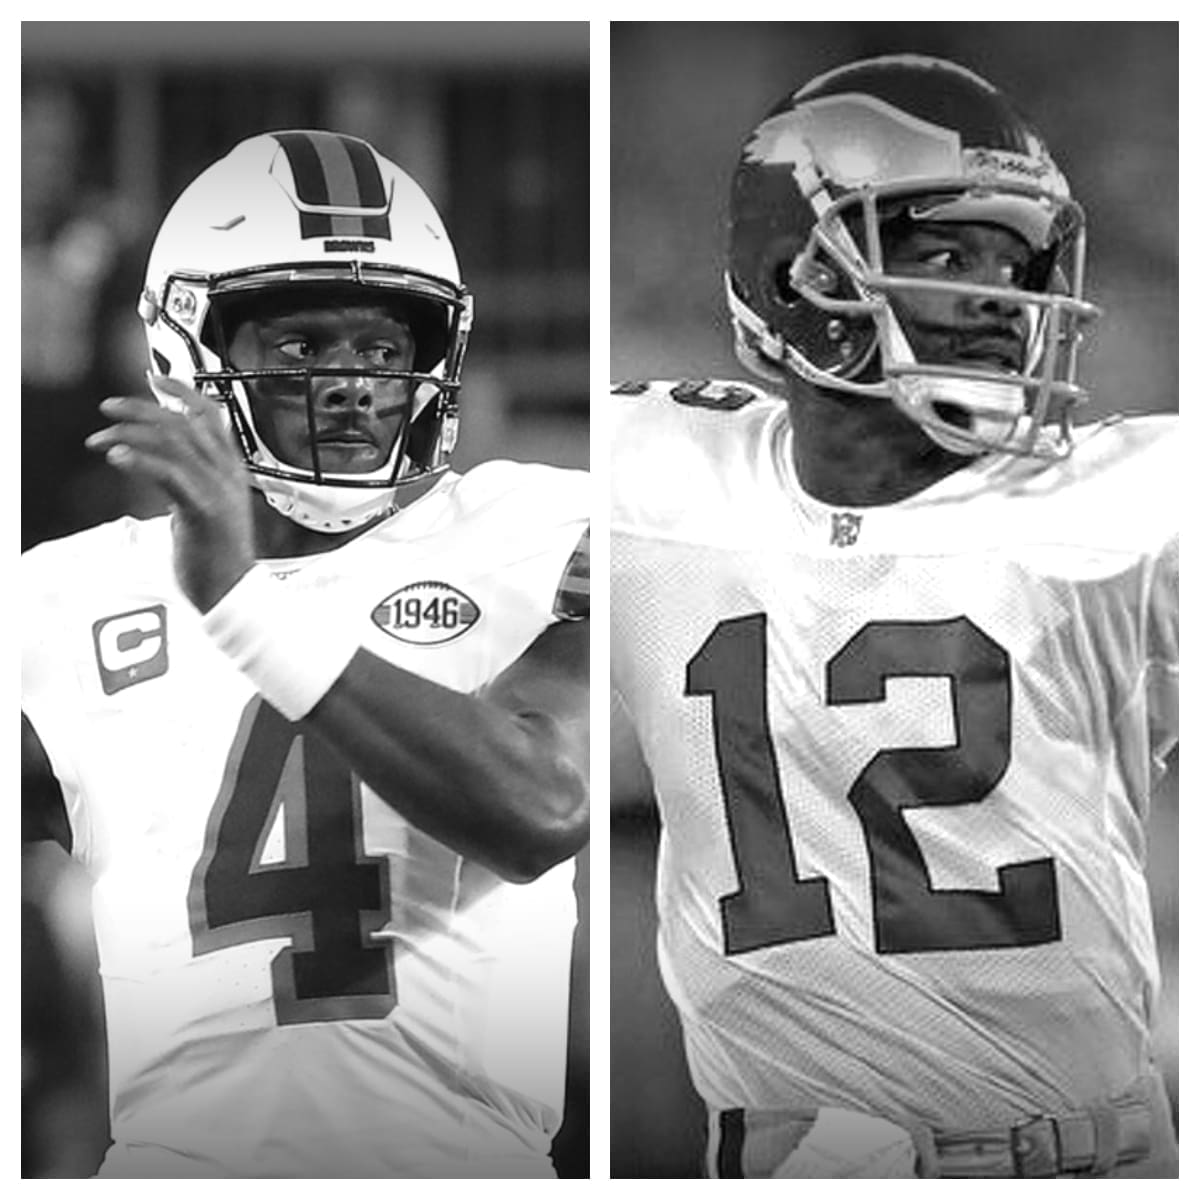
Donovan McNabb, the former NFL quarterback, left a lasting impact on the world of football. His exceptional skills and determination paved the way for him to become one of the most celebrated athletes in the league. In this piece, we will explore McNabb’s career and legacy within the NFL. Born in Tacoma, Washington, on November 25, 1976, Donovan McNabb had a strong penchant for sports from a young age. He grew up playing football and basketball, showcasing an innate talent that caught the attention of college recruiters. After graduating from High School, McNabb committed to the Syracuse University football team. At Syracuse, McNabb’s college career was nothing short of impressive. He led the Orangemen to a Big East Championship in 1998 and earned the Big East Player of the Year Award that same season. In his final year, 1999, McNabb’s athleticism helped Syracuse secure a win in the Fiesta Bowl against the Texas Tech Red Raiders. After a successful college career, it was no surprise that Donovan McNabb would be heavily sought after by NFL teams during the 1999 NFL Draft. The Philadelphia Eagles held the number two overall pick and made the strategic decision to select the talented quarterback. McNabb quickly became a fan favorite in Philadelphia, where he would spend the majority of his NFL career. With five NFC East titles, five Pro Bowl appearances, and one Super Bowl appearance under his belt, McNabb quickly made an enduring mark on the league. His success in the NFL can be attributed to a combination of his strong arm, accurate passing, and mobility in the pocket. He consistently provided excitement for viewers with his electrifying plays, making him one of the most highly respected and sought-after talents in the league. McNabb’s influence extended far beyond the field, as he used his platform to make a positive impact on society. Throughout his career, he became a prominent philanthropist, giving back to local communities and organizations in both Philadelphia and Washington D. C., where he spent the latter part of his NFL tenure. In addition to his philanthropic endeavors, McNabb also advocated for various social issues, including education and civil rights. His dedication to making a difference outside of football secured his legacy as more than just a talented quarterback but as a role model to generations of athletes and fans alike. As Donovan McNabb’s career began to wind down, he signed with the Washington Redskins in 2010. While his final NFL season wasn’t as successful as previous years, it allowed him the opportunity to showcase his resilience and determination in the face of adversity. Despite retiring from the league the following year, McNabb’s extraordinary achievements on and off the field are legends in the annals of football history. His humble beginnings in Tacoma, Washington, marked the beginning of an extraordinary journey that would see him become a champion, a role model, and a philanthropist. His unwavering dedication to hard work, team spirit, and self-improvement continues to be an inspiration for aspiring athletes and sports enthusiasts alike. As we honor the legacy of Donovan McNabb, we celebrate not only his undeniable on-field talent but also the remarkable contributions he made to the communities he served. With the proliferation of social media and coverage of sports stars, Donovan McNabb played a significant role in shaping the contemporary sports culture. His larger-than-life presence in the NFL not only captivated fans but also helped bring attention to critical issues that went beyond the game. A shining example of McNabb’s influence on sports culture is his work to promote equality and inclusivity in the sports world. In a time when race and gender issues were front and center in the national conversation, McNabb used his platform to help raise awareness and bring about change. Additionally, McNabb’s success on the field and resilience in the face of adversity served as a powerful reminder of the transformative power of sports. He demonstrated that athletes could inspire and entertain, but also use their talent for more significant purposes. As a result, Donovan McNabb’s legacy transcends the realm of professional football and solidifies him as an influential figure in American sports culture. His commitment to making the world a better place through his athletic feats and humanitarian efforts will continue to inspire generations of athletes, sports fans, and individuals working to make a difference in their communities. Related Posts
NFL League Minimum: History and Future TrendsThe concept of a league minimum salary in the NFL dates back to the early days of the league. It was established to ensure that all players received a 
NFL Pro Bowl History and EvolutionThe Pro Bowl’s roots can be traced back to 1939 when the first NFL All-Star Game was held. This event featured a matchup between the NFL champion and 
Best NFL Quarterbacks of All-TimeThe quarterback is often considered the most pivotal position in American football. With immense pressure and responsibility, these athletes must exhi 
NFL Honors: Recognizing the League’s Best PlayersEvery year, the NFL Honors ceremony celebrates the finest achievements in professional football. This prestigious event shines a spotlight on the leag 
NFL Playoff History: Memorable MomentsThe NFL playoffs have evolved significantly since the league’s early days, reflecting changes in the sport itself and the growing popularity of profes 
Impact of NFL MVP on Player CareersThe MVP award, bestowed by the Associated Press, is a testament to a player’s exceptional talent, leadership, and influence on the field. Players like 
Strategies for Success in NFL Free AgencyNFL free agency is a period when players who are not under contract can sign with any team. It’s a critical time for teams to strengthen their squads 
How Much Do Scouts Make in the NFL?Before we dive into the specifics of an NFL scout’s salary, it’s essential to understand what exactly these professionals do. NFL scouts are responsib 
What NFL Players Did Martial Arts?The NFL is home to some of the most physically gifted athletes in the world. While football itself is a demanding sport, many NFL players have turned 
How Much is an NFL Pension?Retirement planning is crucial for everyone, including professional athletes. The National Football League (NFL) offers a pension plan to its players, 
How To Become an NFL Referee?Do you dream of being on the field during the biggest football games, making crucial calls, and ensuring fair play? Becoming an NFL referee could be y 
Where is the NFL Hall Of Fame?The Pro Football Hall of Fame, often simply referred to as the NFL Hall of Fame, is a place of reverence for fans of American football. It stands as a 
Who is the Best NFL Team Of All Time?The challenge of naming the best NFL team ever is compounded by the evolution of the game itself. Different eras have emphasized different aspects of 
Did Jim Harbaugh Play In the NFL?When discussing prominent figures in American football, Jim Harbaugh’s name often comes up. Known for his passionate coaching style and strategic acum 
Who Has the Most Interceptions in NFL History?In the electrifying world of football, interceptions stand out as a particularly thrilling aspect of the game. They can dramatically shift momentum, o 
How Many Black Quarterbacks In the NFL?The National Football League (NFL) has a rich history that spans over a century, marked by numerous evolutions and transformations. Throughout this ti 
Which Plays Are Unreviewable In NFL?Before we dive into unreviewable plays, it’s important to understand what constitutes a reviewable play in the NFL. The primary purpose of the review 
What is the Strap Hanging from NFL Players Pants?If you’ve ever watched an NFL game, you might have noticed a curious piece of equipment that many players have hanging from their pants. It’s not unco |