Manning threw for 366 TD’s while tossing 244 picks. His TD percentage was 4.5% and his interception rate was 3.0%. He was driven back 2,466 yds while being sacked 411 times. He finished with 241.6 passing yards per contest. During the 236 games in his career, Manning completed 4,895 of his 8,119 tries for a total of 57,023 yds.
During the 266 contests in his career, Manning completed 6,125 of his 9,380 attempts for a total of 71,940 yards. He finished with 270.5 yards per contest through the air. Manning passed for 539 TD’s while tossing 251 picks. He lost a combined 1,818 yards while being the victim of a quarterback sack 303 times. His TD percentage was 5.7% and his interception percentage was 2.7%.
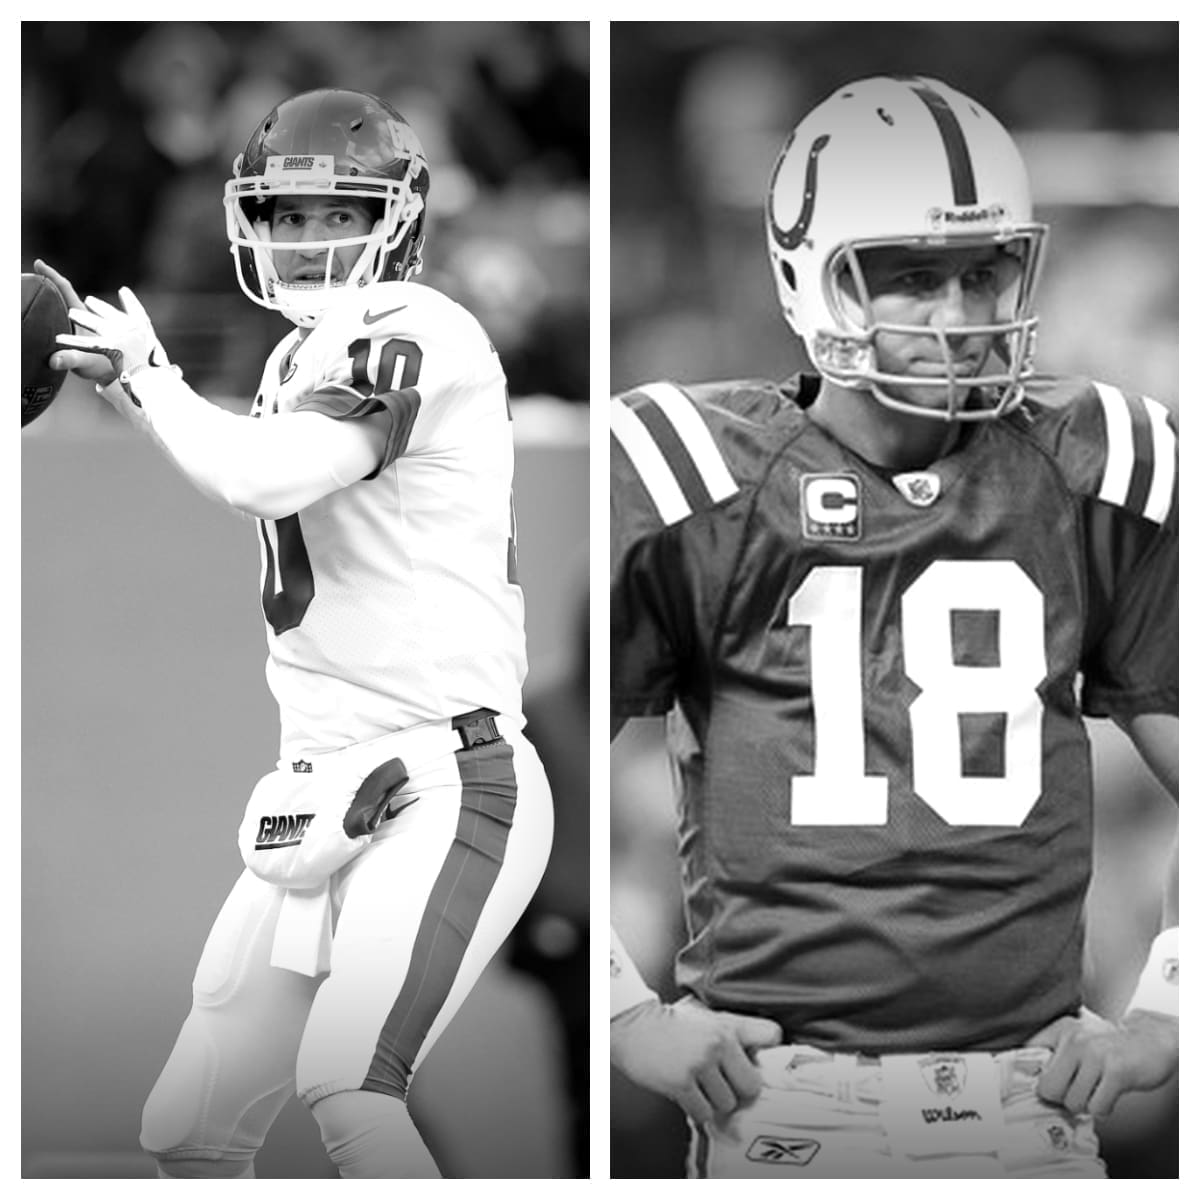
Eli Manning vs Peyton Manning Stats<-h2>
| Eli Manning<-th> | Career<-th> | Peyton Manning<-th><-tr><-thead> |
|---|---|---|
| 236<-td> | Games Played<-td> | 266<-td><-tr> |
| 4,895<-td> | Completions<-td> | 6,125<-td><-tr> |
| 8,119<-td> | Pass Attempts<-td> | 9,380<-td><-tr> |
| 60.3%<-td> | Completion %<-td> | 65.3%<-td><-tr> |
| 57,023<-td> | Passing Yards<-td> | 71,940<-td><-tr> |
| 366<-td> | Passing Touchdowns<-td> | 539<-td><-tr> |
| 4.5%<-td> | Touchdown Percentage<-td> | 5.7%<-td><-tr> |
| 244<-td> | Interceptions<-td> | 251<-td><-tr> |
| 3.0%<-td> | Interception Percentage<-td> | 2.7%<-td><-tr> |
| 7.0<-td> | Yards Per Pass Attempt<-td> | 7.7<-td><-tr> |
| 6.6<-td> | Adjusted Yards Per Pass Attempt<-td> | 7.6<-td><-tr> |
| 11.6<-td> | Yards Per Completion<-td> | 11.7<-td><-tr> |
| 241.6<-td> | Passing Yards Per Game<-td> | 270.5<-td><-tr> |
| 411<-td> | Times Sacked<-td> | 303<-td><-tr> |
| 5.1%<-td> | Sack Percentage<-td> | 3.2%<-td><-tr><-tr><-tbody><-table>
Eli Manning, a budding star quarterback with a poised demeanor and natural leadership, began his collegiate career at the University of Mississippi, a. k. a Ole Miss Rebels. A two-time consensus All-American and Ole Miss’ leading passer and touchdown scorer, the 6′ 5″, 218 lb. athlete drafted the 2004 NFL draft where his journey in the National Football League officially began. Although prepared to be drafted by the San Diego Chargers, he made it abundantly clear that playing for the New York Giants was his preferred choice. Thus, the Manning family made history by orchestrating a trade between the New York Giants and the San Diego Chargers. The Chargers got the best of the bargain, as they gained five draft picks and one player, while the Giants received a young and promising draft pick in Eli. Eli Manning’s professional career got off to a steady start, as he initially shared snaps with Kurt Warner. His rookie season was met with a rough start, as he completed fewer than half of his passes, amassing only 483 yards and three scores. Undeterred, his performance trajectory revitalized under the tutelage and guidance of Tom Coughlin and Mike Sullivan as his coaches. The Giants coach-player partnership bore fruit in the 2007 and 2011 postseasons, where Manning’s impulsive, yet calculated decision-making skills took center stage. Under intense pressure and adverse weather conditions, Manning led the Giants to an unforgettable victory against the heavily favored New England Patriots in Super Bowl XLII. This nail-biting match ended with Manning’s last-minute 32-yard touchdown throw to receiver Plaxico Burress, ultimately sealing the Giants’ 17-14 triumph. The New York Giants faced the Patriots once more in Super Bowl XLVI in 2011. The match was filled with an intense battle of field control, pressure, and an outstanding performance by Eli Manning who completed 30 of 40 passes for 296 yards and a touchdown. With outstanding defense, Manning marched down the field to set up the game-winning field goal that sealed another Giants victory. Beyond his Super Bowl triumphs, Manning has had a remarkable career marked by numerous milestones. Among them are the match-saving completion at the 2011 NFC Championship Game, as well as his exceptionally prolonged reliability as a starting quarterback since 2005, placing him among the ranks of Hall of Famers such as Peyton Manning and Tom Brady. Manning’s career in the NFL is not just about his on-field success; it’s also about his contributions off the field. He has proven to be more than just a star quarterback, becoming a profoundly respected figure and a role model. His contributions to various charitable initiatives have seen him establish his own foundation, ‘The Eli Manning Children’s Clinic’, which provides quality health care to children in Mississippi. A testament to Manning’s resilience is his ability to maintain a high level of performance under immense pressure. Despite facing numerous setbacks including multiple foot and leg injuries, criticism for overthrows, and multiple benchings, he has continuously proved himself to be a dependable and reliable leader. In 2019, after sixteen seasons with the Giants, Manning, with a heartfelt letter to the fans, officially announced his retirement from professional football. Reflecting on a highly accomplished career, Manning’s speech was laden with admiration for his teammates, coaches, the New York Giants organization, and the fans. The career stats of Eli Manning speak for themselves. Amassing an impressive 57,023 passing yards and an 8-4 playoff record, his achievements have already secured a solid footing in the history of NFL. As the future Hall of Famer for years to come, Eli Manning’s journey is one that is imbued with grit, determination, and sheer passion for the game an inspiration for aspiring football stars. As Manning moves into the second chapter of his life, he now sets his sights on new goals and challenges. However, his time in the NFL will forever be remembered as a testament to hard work, unwavering determination, and a true mastery of the position of a quarterback. Becoming a Hall of Famer signifies not just success in the game but also the indelible mark left by the player over the course of their career. Eli Manning, with his two Super Bowl MVP awards, 11 Pro Bowl appearances, and a huge impact both on and off the field, has surely carved out a legacy deserving of such an honor. As we reminisce on his time in the NFL, we can only marvel at his many accomplishments and the inspiring journey he undertook to cement himself as one of the greatest quarterbacks tapping the league has ever seen.  Related Posts
NFL League Minimum: History and Future TrendsThe concept of a league minimum salary in the NFL dates back to the early days of the league. It was established to ensure that all players received a 
NFL Pro Bowl History and EvolutionThe Pro Bowl’s roots can be traced back to 1939 when the first NFL All-Star Game was held. This event featured a matchup between the NFL champion and 
Best NFL Quarterbacks of All-TimeThe quarterback is often considered the most pivotal position in American football. With immense pressure and responsibility, these athletes must exhi 
NFL Honors: Recognizing the League’s Best PlayersEvery year, the NFL Honors ceremony celebrates the finest achievements in professional football. This prestigious event shines a spotlight on the leag 
NFL Playoff History: Memorable MomentsThe NFL playoffs have evolved significantly since the league’s early days, reflecting changes in the sport itself and the growing popularity of profes 
Impact of NFL MVP on Player CareersThe MVP award, bestowed by the Associated Press, is a testament to a player’s exceptional talent, leadership, and influence on the field. Players like 
Strategies for Success in NFL Free AgencyNFL free agency is a period when players who are not under contract can sign with any team. It’s a critical time for teams to strengthen their squads 
How Much Do Scouts Make in the NFL?Before we dive into the specifics of an NFL scout’s salary, it’s essential to understand what exactly these professionals do. NFL scouts are responsib 
What NFL Players Did Martial Arts?The NFL is home to some of the most physically gifted athletes in the world. While football itself is a demanding sport, many NFL players have turned 
How Much is an NFL Pension?Retirement planning is crucial for everyone, including professional athletes. The National Football League (NFL) offers a pension plan to its players, 
How To Become an NFL Referee?Do you dream of being on the field during the biggest football games, making crucial calls, and ensuring fair play? Becoming an NFL referee could be y 
Where is the NFL Hall Of Fame?The Pro Football Hall of Fame, often simply referred to as the NFL Hall of Fame, is a place of reverence for fans of American football. It stands as a 
Who is the Best NFL Team Of All Time?The challenge of naming the best NFL team ever is compounded by the evolution of the game itself. Different eras have emphasized different aspects of 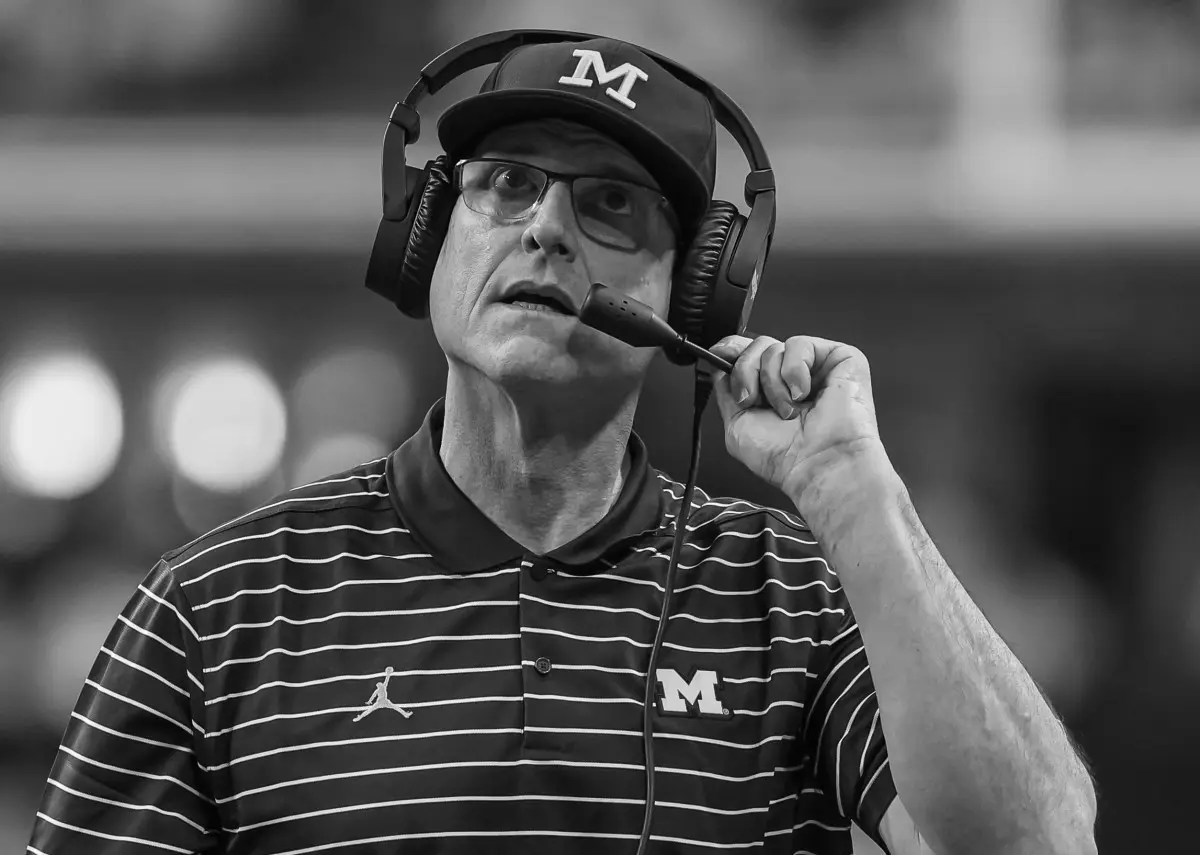
Did Jim Harbaugh Play In the NFL?When discussing prominent figures in American football, Jim Harbaugh’s name often comes up. Known for his passionate coaching style and strategic acum 
Who Has the Most Interceptions in NFL History?In the electrifying world of football, interceptions stand out as a particularly thrilling aspect of the game. They can dramatically shift momentum, o 
How Many Black Quarterbacks In the NFL?The National Football League (NFL) has a rich history that spans over a century, marked by numerous evolutions and transformations. Throughout this ti 
Which Plays Are Unreviewable In NFL?Before we dive into unreviewable plays, it’s important to understand what constitutes a reviewable play in the NFL. The primary purpose of the review 
What is the Strap Hanging from NFL Players Pants?If you’ve ever watched an NFL game, you might have noticed a curious piece of equipment that many players have hanging from their pants. It’s not unco |