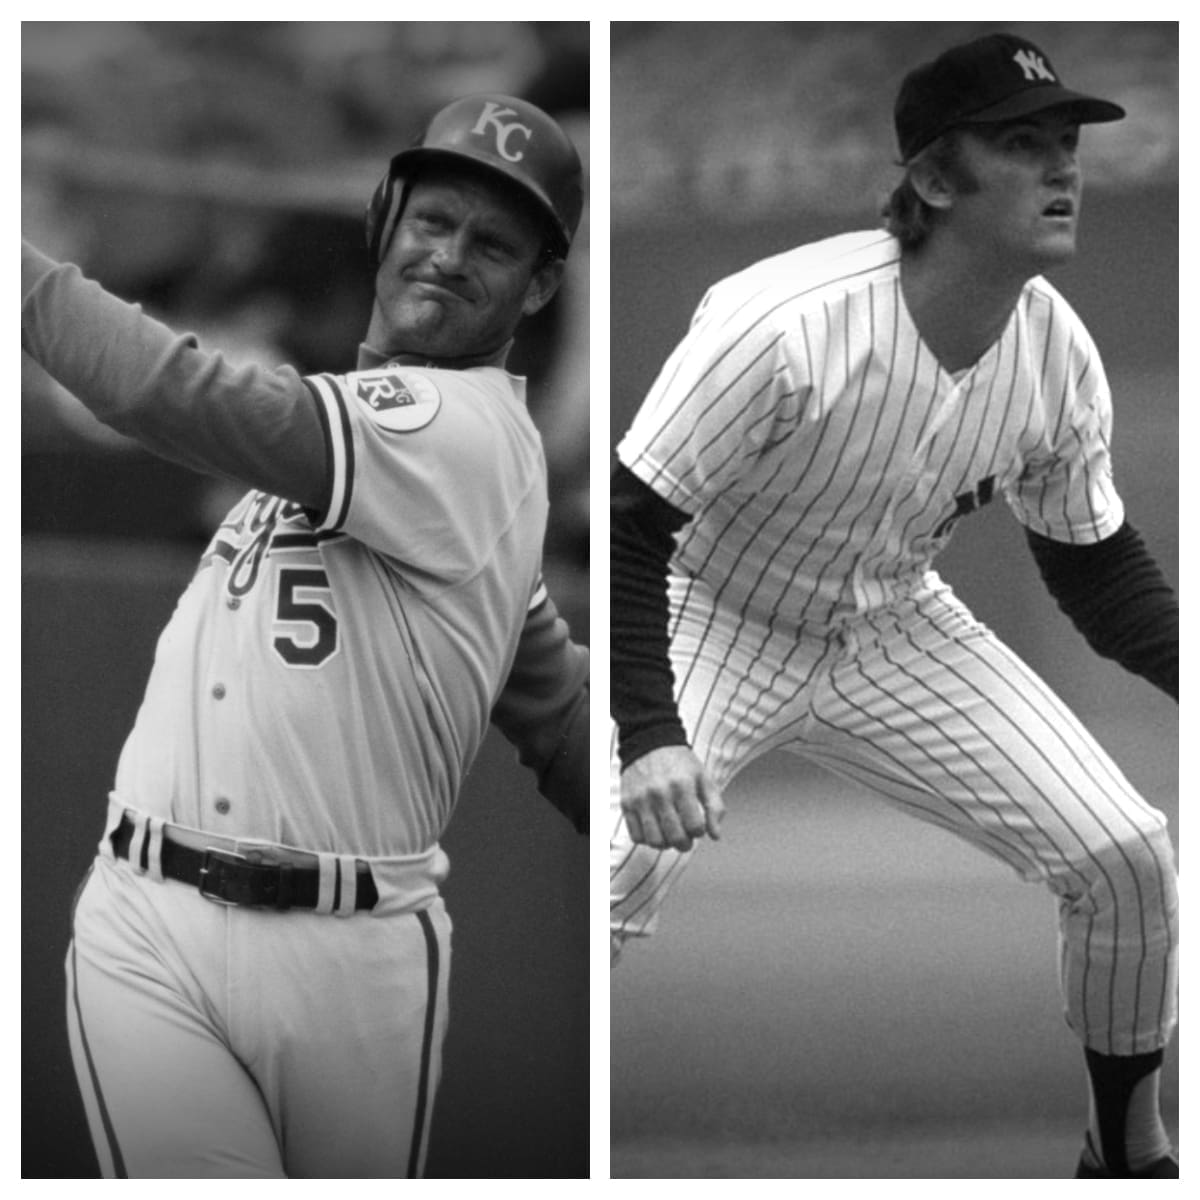
For his pro baseball career, Brett has hit 317 balls out of the park while driving in 1,596 runs. In his time spent in pro baseball, he stepped into the batters box 11,625 times and has come through with a hit 3,154 times. His slugging percentage sits at -.006 in addition to earning 5,044 bases. He has fanned 908 times and earned a walk on 1,096 occasions, contributing to a .369 OBP. Brett has hit .305 for his time in baseball with 1,583 scored runs and an OPS of .363.
In the 8,986 official at-bats in his baseball career, Nettles has an average at the plate of .248 in addition to 2,225 base hits. He has gone deep 390 times, as well as 3,779 bases in total and also a .002 slugging percentage. Nettles has recorded a walk 1,088 times while being called out on strikes on 1,209 attempts. He has accounted for 1,193 runs and racked up 1,314 RBIs. His on-base percentage sits at .329 and he has earned a career OPS of .331.
| George Brett | Career | Graig Nettles |
|---|---|---|
| 2,707 | Games Played | 2,700 |
| 11,625 | Plate Appearances | 10,228 |
| 10,349 | At-Bats | 8,986 |
| 1,583 | Runs | 1,193 |
| 3,154 | Hits | 2,225 |
| 665 | Doubles | 328 |
| 137 | Triples | 28 |
| 317 | Home Runs | 390 |
| 1,596 | Runs Batted In | 1,314 |
| 201 | Stolen Bases | 32 |
| 97 | Caught Stealing | 36 |
| 1,096 | Walks | 1,088 |
| 908 | Strikeouts | 1,209 |
| .305 | Batting Average | .248 |
| .369 | On-Base Percentage | .329 |
| -.006 | Slugging Percentage | .002 |
| 0.363 | OPS | 0.331 |
| 5,044 | Total Bases | 3,779 |
| 235 | Grounded Into Double Plays | 197 |
| 33 | Hit By Pitch | 50 |