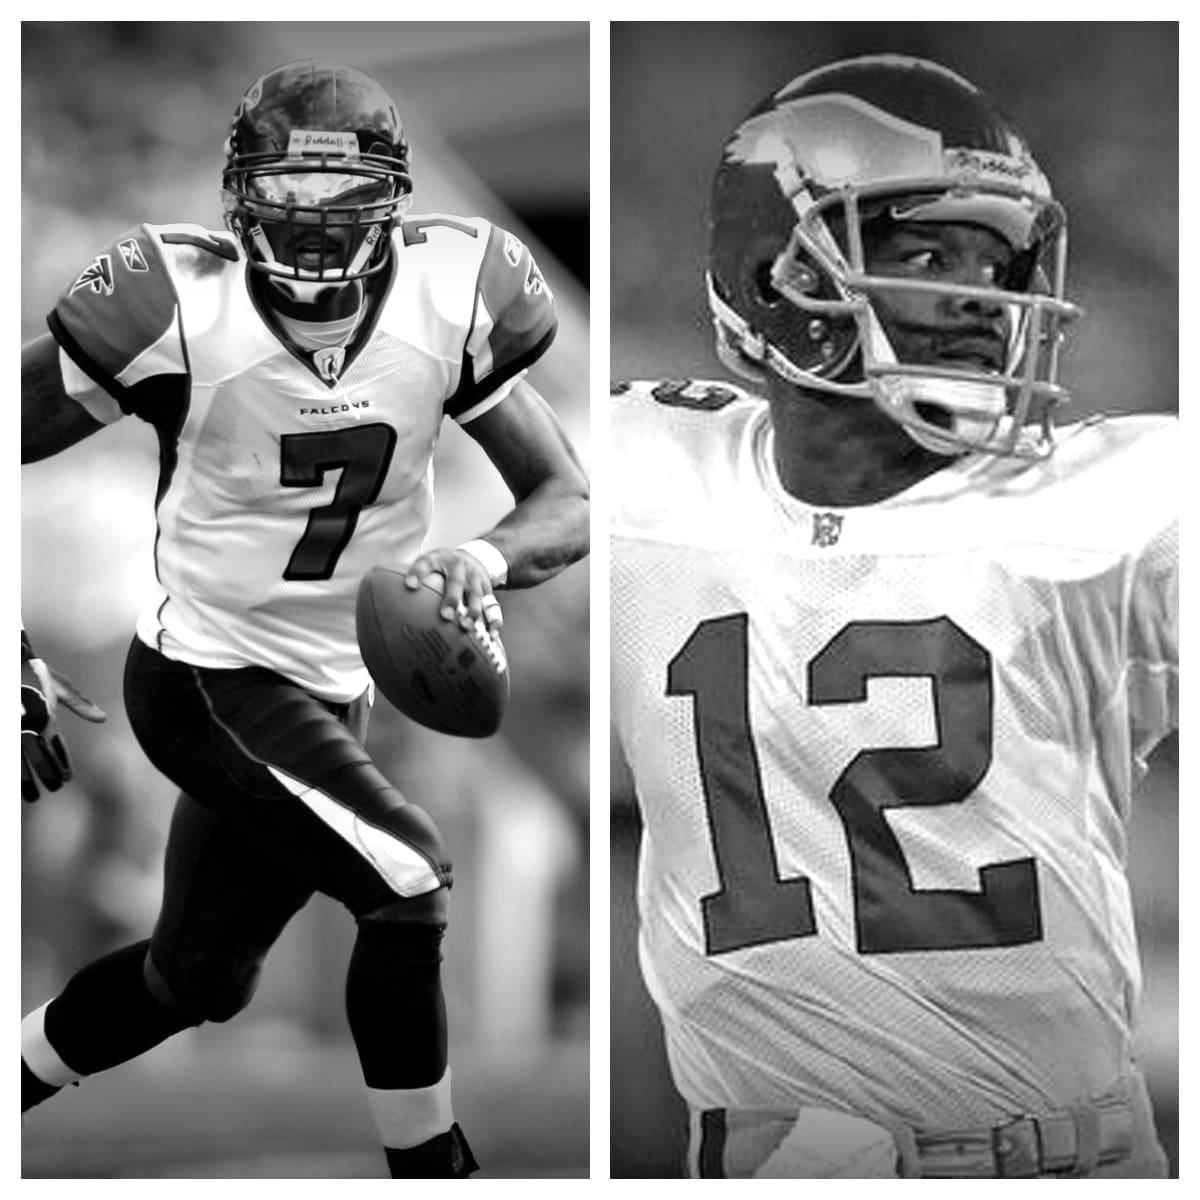
In the 143 contests in his career, Vick was successful on 1,807 of 3,217 attempts for 22,464 yds. He averaged 157.1 yds per contest through the air. Vick passed for 133 touchdowns while tossing 88 interceptions. He lost 1,896 yds while being sacked 316 times. His touchdown rate on pass attempts was 4.1% and his interception percentage was 2.7%.
During the 161 contests in his career, Cunningham completed 2,429 of 4,289 tries for 29,979 yards. He averaged 186.2 yards per game through the air. Cunningham passed for 207 TD’s compared to 134 interceptions. He lost 2,904 yds while being the victim of a quarterback sack 484 times. His touchdown percentage was 4.8% and his interception rate was 3.1%.
Michael Vick vs Randall Cunningham Stats<-h2>
| Michael Vick<-th> | Career<-th> | Randall Cunningham<-th><-tr><-thead> |
|---|---|---|
| 143<-td> | Games Played<-td> | 161<-td><-tr> |
| 1,807<-td> | Completions<-td> | 2,429<-td><-tr> |
| 3,217<-td> | Pass Attempts<-td> | 4,289<-td><-tr> |
| 56.2%<-td> | Completion %<-td> | 56.6%<-td><-tr> |
| 22,464<-td> | Passing Yards<-td> | 29,979<-td><-tr> |
| 133<-td> | Passing Touchdowns<-td> | 207<-td><-tr> |
| 4.1%<-td> | Touchdown Percentage<-td> | 4.8%<-td><-tr> |
| 88<-td> | Interceptions<-td> | 134<-td><-tr> |
| 2.7%<-td> | Interception Percentage<-td> | 3.1%<-td><-tr> |
| 7.0<-td> | Yards Per Pass Attempt<-td> | 7.0<-td><-tr> |
| 6.6<-td> | Adjusted Yards Per Pass Attempt<-td> | 6.5<-td><-tr> |
| 12.4<-td> | Yards Per Completion<-td> | 12.3<-td><-tr> |
| 157.1<-td> | Passing Yards Per Game<-td> | 186.2<-td><-tr> |
| 316<-td> | Times Sacked<-td> | 484<-td><-tr> |
| 9.8%<-td> | Sack Percentage<-td> | 11.3%<-td><-tr><-tr><-tbody><-table>
Michael Vick is a former American football quarterback who played in the National Football League for 13 years. He was drafted by the Atlanta Falcons in the first round of the 2001 NFL Draft, and during his career, he played for the Falcons, Philadelphia Eagles, and New York Jets. Michael Vick’s NFL career started on a high note when he was drafted by the Atlanta Falcons. He was considered a promising player due to his incredible speed and agility, as well as his strong arm. During his first season, he played mostly as a backup quarterback and rushed for 777 yards on 422 carries, an impressive feat for a quarterback. In his second season, he became the starting quarterback and led the Falcons to the playoffs. During his time with the Falcons, Michael Vick proved to be an excellent dual-threat quarterback, capable of both passing and rushing. He led the league in rushing yards by a quarterback in his 2002 season and set a record with 1736 yards in 2006. His highlight moments include leading the Falcons to their first-ever postseason victory in 2002 and achieving a career-high passer rating of 103. 7 in 2010. Despite his impressive career with the Falcons, Michael Vick’s life took a dramatic turn when he was arrested and convicted in 2007 for his involvement in a dogfighting ring. He was sentenced to 23 months in federal prison and two months in home confinement, which resulted in him serving time and losing a significant portion of his career. He was released from prison in 2009 and later that year, he signed with the Philadelphia Eagles. After his release from prison, Michael Vick signed a one-year contract with the Philadelphia Eagles, who were willing to give him a second chance. During his time with the Eagles, he played as a backup quarterback and was often praised for his work ethic and dedication. In 2010, he was named the NFL Comeback Player of the Year, making a significant comeback to the league. In 2014, Michael Vick signed with the New York Jets, where he played his final season in the NFL. After a highly successful career, marred by personal setbacks, Michael Vick is remembered as one of the most exciting quarterbacks to ever play in the NFL. His unique playing style and ability to be a dual-threat quarterback left a lasting impression on the league and its fans. Michael Vick’s Impact on the NFL Michael Vick’s playing style and unique abilities changed the way the game of football was approached and played. He was one of the first dual-threat quarterbacks who could both pass and run with incredible speed and agility. His ability to make explosive plays both in the air and on the ground made the Falcons one of the most exciting teams to watch during his time with the team. In addition to his on-field accomplishments, Michael Vick’s personal story is also a testament to the power of redemption and second chances. After serving time in prison, he was able to return to the NFL and make a significant impact, both on and off the field. He used his platform to raise awareness about animal abuse and advocate for change. Today, Michael Vick is remembered as one of the most electrifying players in NFL history. His ability to change the game of football and his personal comeback story will continue to inspire future generations of athletes. Despite his fall from grace, he was able to prove that with hard work, determination, and perseverance, anyone can overcome even the toughest setbacks. In conclusion, Michael Vick’s NFL career was a roller coaster ride filled with highs and lows. From being drafted by the Falcons to serving time in prison and then making a comeback with the Eagles, his story is a testament to the power of resilience. While his personal life has faced many challenges, his impact on the NFL cannot be denied. He will always be remembered as one of the most dynamic and exciting players to ever take the field. Related Posts
NFL League Minimum: History and Future TrendsThe concept of a league minimum salary in the NFL dates back to the early days of the league. It was established to ensure that all players received a 
NFL Pro Bowl History and EvolutionThe Pro Bowl’s roots can be traced back to 1939 when the first NFL All-Star Game was held. This event featured a matchup between the NFL champion and 
Best NFL Quarterbacks of All-TimeThe quarterback is often considered the most pivotal position in American football. With immense pressure and responsibility, these athletes must exhi 
NFL Honors: Recognizing the League’s Best PlayersEvery year, the NFL Honors ceremony celebrates the finest achievements in professional football. This prestigious event shines a spotlight on the leag 
NFL Playoff History: Memorable MomentsThe NFL playoffs have evolved significantly since the league’s early days, reflecting changes in the sport itself and the growing popularity of profes 
Impact of NFL MVP on Player CareersThe MVP award, bestowed by the Associated Press, is a testament to a player’s exceptional talent, leadership, and influence on the field. Players like 
Strategies for Success in NFL Free AgencyNFL free agency is a period when players who are not under contract can sign with any team. It’s a critical time for teams to strengthen their squads 
How Much Do Scouts Make in the NFL?Before we dive into the specifics of an NFL scout’s salary, it’s essential to understand what exactly these professionals do. NFL scouts are responsib 
What NFL Players Did Martial Arts?The NFL is home to some of the most physically gifted athletes in the world. While football itself is a demanding sport, many NFL players have turned 
How Much is an NFL Pension?Retirement planning is crucial for everyone, including professional athletes. The National Football League (NFL) offers a pension plan to its players, 
How To Become an NFL Referee?Do you dream of being on the field during the biggest football games, making crucial calls, and ensuring fair play? Becoming an NFL referee could be y 
Where is the NFL Hall Of Fame?The Pro Football Hall of Fame, often simply referred to as the NFL Hall of Fame, is a place of reverence for fans of American football. It stands as a 
Who is the Best NFL Team Of All Time?The challenge of naming the best NFL team ever is compounded by the evolution of the game itself. Different eras have emphasized different aspects of 
Did Jim Harbaugh Play In the NFL?When discussing prominent figures in American football, Jim Harbaugh’s name often comes up. Known for his passionate coaching style and strategic acum 
Who Has the Most Interceptions in NFL History?In the electrifying world of football, interceptions stand out as a particularly thrilling aspect of the game. They can dramatically shift momentum, o 
How Many Black Quarterbacks In the NFL?The National Football League (NFL) has a rich history that spans over a century, marked by numerous evolutions and transformations. Throughout this ti 
Which Plays Are Unreviewable In NFL?Before we dive into unreviewable plays, it’s important to understand what constitutes a reviewable play in the NFL. The primary purpose of the review 
What is the Strap Hanging from NFL Players Pants?If you’ve ever watched an NFL game, you might have noticed a curious piece of equipment that many players have hanging from their pants. It’s not unco |