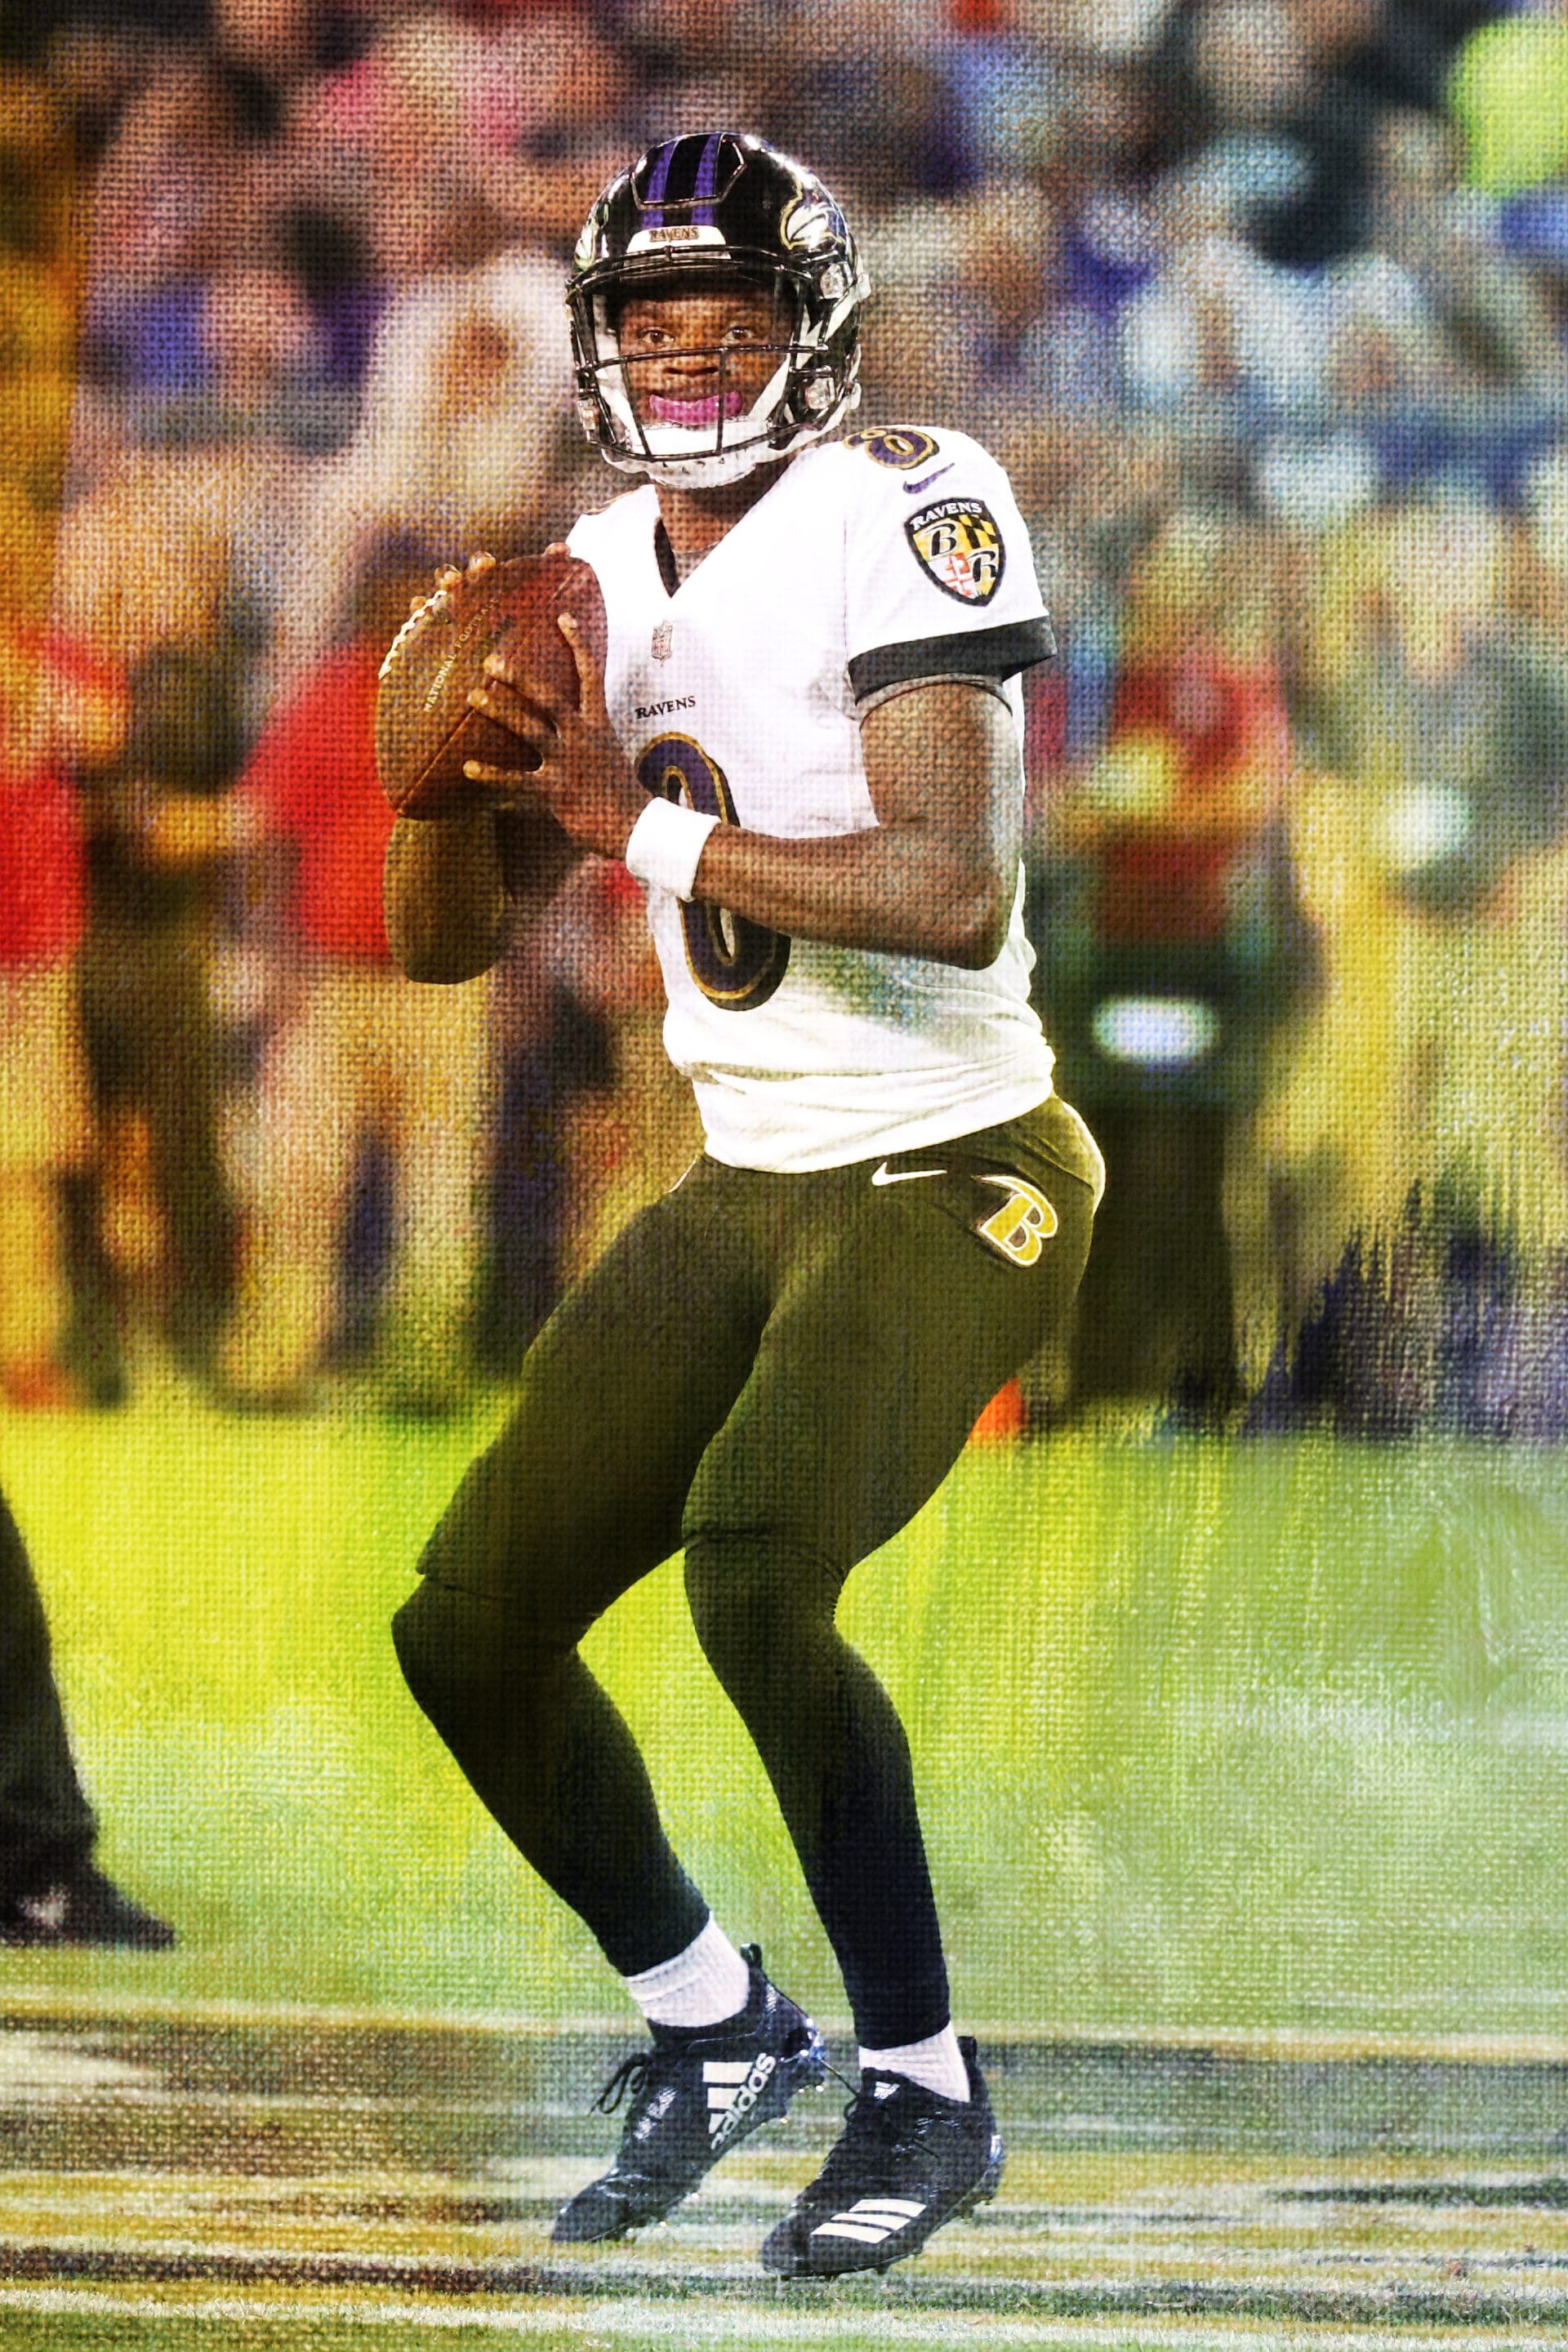
When talking about the 2024 season, the Baltimore Ravens lead all teams in total yards per contest with 424.9. Holding second place are the Detroit Lions, collecting a total yds per game total of 409.5. Having a tally of 399.6, the Tampa Bay Buccaneers are sitting in the 3rd spot. Finishing out the top 5 are the San Francisco 49ers (376.3) and the Green Bay Packers (370.8).
2024 NFL Team Total Yards Per Game Leaders
| Rank | Team | Stat |
|---|---|---|
| 1st | Baltimore Ravens | 424.9 |
| 2nd | Detroit Lions | 409.5 |
| 3rd | Tampa Bay Buccaneers | 399.6 |
| 4th | San Francisco 49ers | 376.3 |
| 5th | Green Bay Packers | 370.8 |
| 6th | Atlanta Falcons | 369.8 |
| 7th | Washington Commanders | 369.6 |
| 8th | Philadelphia Eagles | 367.2 |
| 9th | Cincinnati Bengals | 365.5 |
| 10th | Buffalo Bills | 359.1 |
| 11th | Arizona Cardinals | 358.2 |
| 12th | Minnesota Vikings | 346.9 |
| 13th | Indianapolis Colts | 334.8 |
| 14th | Seattle Seahawks | 332.2 |
| 15th | Los Angeles Rams | 331.4 |
| 16th | Kansas City Chiefs | 327.6 |
| 17th | Dallas Cowboys | 327.5 |
| 18th | Miami Dolphins | 325.4 |
| 19th | Denver Broncos | 324.6 |
| 20th | Los Angeles Chargers | 324.2 |
| 21st | New Orleans Saints | 320.1 |
| 22nd | Houston Texans | 319.7 |
| 23rd | Pittsburgh Steelers | 319.4 |
| 24th | New York Jets | 310.3 |
| 25th | Jacksonville Jaguars | 306.2 |
| 26th | Tennessee Titans | 304.2 |
| 27th | Las Vegas Raiders | 303.2 |
| 28th | Cleveland Browns | 300.8 |
| 29th | Carolina Panthers | 298.0 |
| 30th | New York Giants | 294.8 |
2022 NFL Team Total Yards Per Game Leaders
| Rank | Team | Stat |
|---|---|---|
| 1st | Kansas City Chiefs | 413.6 |
| 2nd | Buffalo Bills | 397.6 |
| 3rd | Philadelphia Eagles | 389.1 |
| 4th | Detroit Lions | 380.0 |
| 5th | San Francisco 49ers | 365.6 |
| 6th | Miami Dolphins | 364.5 |
| 7th | Minnesota Vikings | 361.5 |
| 8th | Cincinnati Bengals | 360.5 |
| 9th | Los Angeles Chargers | 359.3 |
| 10th | Jacksonville Jaguars | 357.4 |
| 11th | Dallas Cowboys | 354.9 |
| 12th | Las Vegas Raiders | 352.5 |
| 13th | Seattle Seahawks | 351.5 |
| 14th | Cleveland Browns | 349.1 |
| 15th | Tampa Bay Buccaneers | 346.7 |
| 16th | Baltimore Ravens | 338.8 |
| 17th | Green Bay Packers | 337.9 |
| 18th | New York Giants | 333.9 |
| 19th | New Orleans Saints | 333.8 |
| 20th | Washington Commanders | 330.3 |
| 21st | Denver Broncos | 325.1 |
| 22nd | Arizona Cardinals | 323.5 |
| 23rd | Pittsburgh Steelers | 322.6 |
| 24th | Atlanta Falcons | 318.6 |
| 25th | New York Jets | 318.2 |
| 26th | New England Patriots | 314.6 |
| 27th | Indianapolis Colts | 311.6 |
| 28th | Chicago Bears | 307.8 |
| 29th | Carolina Panthers | 306.2 |
| 30th | Tennessee Titans | 296.8 |
2021 NFL Team Total Yards Per Game Leaders
| Rank | Team | Stat |
|---|---|---|
| 1st | Dallas Cowboys | 407.0 |
| 2nd | Tampa Bay Buccaneers | 405.9 |
| 3rd | Kansas City Chiefs | 396.8 |
| 4th | Los Angeles Chargers | 390.2 |
| 5th | Buffalo Bills | 381.9 |
| 6th | Baltimore Ravens | 378.8 |
| 7th | San Francisco 49ers | 375.7 |
| 8th | Arizona Cardinals | 373.6 |
| 9th | Los Angeles Rams | 372.1 |
| 10th | Green Bay Packers | 365.6 |
| 11th | Las Vegas Raiders | 363.8 |
| 12th | Minnesota Vikings | 362.8 |
| 13th | Cincinnati Bengals | 361.5 |
| 14th | Philadelphia Eagles | 359.9 |
| 15th | New England Patriots | 353.4 |
| 16th | Indianapolis Colts | 347.1 |
| 17th | Tennessee Titans | 342.5 |
| 18th | Cleveland Browns | 340.6 |
| 19th | Denver Broncos | 330.5 |
| 20th | Seattle Seahawks | 323.9 |
| 21st | Washington Football Team | 323.6 |
| 22nd | Detroit Lions | 322.6 |
| 23rd | Pittsburgh Steelers | 315.4 |
| 24th | Chicago Bears | 307.4 |
| 25th | Miami Dolphins | 307.0 |
| 26th | New York Jets | 306.4 |
| 27th | Jacksonville Jaguars | 305.4 |
| 28th | New Orleans Saints | 304.5 |
| 29th | Atlanta Falcons | 303.8 |
| 30th | Carolina Panthers | 298.9 |
2020 NFL Team Total Yards Per Game Leaders
| Rank | Team | Stat |
|---|---|---|
| 1st | Kansas City Chiefs | 415.8 |
| 2nd | Buffalo Bills | 396.4 |
| 3rd | Tennessee Titans | 396.4 |
| 4th | Minnesota Vikings | 393.3 |
| 5th | Green Bay Packers | 389.0 |
| 6th | Arizona Cardinals | 384.6 |
| 7th | Tampa Bay Buccaneers | 384.1 |
| 8th | Las Vegas Raiders | 383.3 |
| 9th | Los Angeles Chargers | 382.1 |
| 10th | Indianapolis Colts | 378.1 |
| 11th | Los Angeles Rams | 377.0 |
| 12th | New Orleans Saints | 376.4 |
| 13th | Houston Texans | 375.3 |
| 14th | Dallas Cowboys | 371.8 |
| 15th | San Francisco 49ers | 370.1 |
| 16th | Cleveland Browns | 369.6 |
| 17th | Seattle Seahawks | 369.5 |
| 18th | Atlanta Falcons | 368.4 |
| 19th | Baltimore Ravens | 363.1 |
| 20th | Detroit Lions | 350.2 |
| 21st | Carolina Panthers | 349.5 |
| 22nd | Miami Dolphins | 339.0 |
| 23rd | Denver Broncos | 335.6 |
| 24th | Pittsburgh Steelers | 334.6 |
| 25th | Philadelphia Eagles | 334.6 |
| 26th | Chicago Bears | 331.4 |
| 27th | New England Patriots | 327.3 |
| 28th | Jacksonville Jaguars | 326.1 |
| 29th | Cincinnati Bengals | 319.8 |
| 30th | Washington Football Team | 317.3 |
2019 NFL Team Total Yards Per Game Leaders
| Rank | Team | Stat |
|---|---|---|
| 1st | Dallas Cowboys | 431.5 |
| 2nd | Baltimore Ravens | 407.6 |
| 3rd | Tampa Bay Buccaneers | 397.9 |
| 4th | San Francisco 49ers | 381.1 |
| 5th | Atlanta Falcons | 379.7 |
| 6th | Kansas City Chiefs | 379.2 |
| 7th | Los Angeles Rams | 374.9 |
| 8th | Seattle Seahawks | 374.4 |
| 9th | New Orleans Saints | 373.9 |
| 10th | Los Angeles Chargers | 367.4 |
| 11th | Oakland Raiders | 363.7 |
| 12th | Tennessee Titans | 362.8 |
| 13th | Houston Texans | 362.0 |
| 14th | Philadelphia Eagles | 360.8 |
| 15th | New England Patriots | 354.0 |
| 16th | Minnesota Vikings | 353.5 |
| 17th | Detroit Lions | 346.8 |
| 18th | Green Bay Packers | 345.5 |
| 19th | Carolina Panthers | 341.8 |
| 20th | Jacksonville Jaguars | 341.8 |
| 21st | Arizona Cardinals | 341.7 |
| 22nd | Cleveland Browns | 340.9 |
| 23rd | New York Giants | 338.5 |
| 24th | Buffalo Bills | 330.2 |
| 25th | Indianapolis Colts | 327.4 |
| 26th | Cincinnati Bengals | 323.1 |
| 27th | Miami Dolphins | 310.0 |
| 28th | Denver Broncos | 298.6 |
| 29th | Chicago Bears | 296.8 |
| 30th | Pittsburgh Steelers | 276.8 |
2018 NFL Team Total Yards Per Game Leaders
| Rank | Team | Stat |
|---|---|---|
| 1st | Kansas City Chiefs | 425.6 |
| 2nd | Los Angeles Rams | 421.1 |
| 3rd | Tampa Bay Buccaneers | 415.5 |
| 4th | Pittsburgh Steelers | 403.3 |
| 5th | New England Patriots | 393.4 |
| 6th | Atlanta Falcons | 389.1 |
| 7th | Indianapolis Colts | 386.2 |
| 8th | New Orleans Saints | 379.2 |
| 9th | Baltimore Ravens | 374.9 |
| 10th | Carolina Panthers | 373.3 |
| 11th | Los Angeles Chargers | 372.6 |
| 12th | Green Bay Packers | 369.1 |
| 13th | Cleveland Browns | 368.8 |
| 14th | Philadelphia Eagles | 365.3 |
| 15th | Houston Texans | 362.6 |
| 16th | San Francisco 49ers | 360.6 |
| 17th | New York Giants | 356.1 |
| 18th | Seattle Seahawks | 353.3 |
| 19th | Denver Broncos | 350.1 |
| 20th | Minnesota Vikings | 345.6 |
| 21st | Chicago Bears | 343.9 |
| 22nd | Dallas Cowboys | 343.8 |
| 23rd | Oakland Raiders | 336.2 |
| 24th | Detroit Lions | 327.3 |
| 25th | Tennessee Titans | 312.6 |
| 26th | Cincinnati Bengals | 310.8 |
| 27th | Jacksonville Jaguars | 302.0 |
| 28th | Washington Redskins | 299.7 |
| 29th | New York Jets | 299.2 |
| 30th | Buffalo Bills | 298.6 |
2017 NFL Team Total Yards Per Game Leaders
| Rank | Team | Stat |
|---|---|---|
| 1st | New England Patriots | 394.2 |
| 2nd | New Orleans Saints | 391.2 |
| 3rd | Pittsburgh Steelers | 377.9 |
| 4th | Los Angeles Chargers | 376.6 |
| 5th | Kansas City Chiefs | 375.4 |
| 6th | Jacksonville Jaguars | 365.9 |
| 7th | Philadelphia Eagles | 365.8 |
| 8th | Atlanta Falcons | 364.8 |
| 9th | Tampa Bay Buccaneers | 363.4 |
| 10th | Los Angeles Rams | 361.5 |
| 11th | Minnesota Vikings | 356.9 |
| 12th | San Francisco 49ers | 349.2 |
| 13th | Detroit Lions | 337.8 |
| 14th | Dallas Cowboys | 331.9 |
| 15th | Seattle Seahawks | 330.4 |
| 16th | Washington Redskins | 324.9 |
| 17th | Oakland Raiders | 324.1 |
| 18th | Denver Broncos | 324.1 |
| 19th | Carolina Panthers | 323.7 |
| 20th | Houston Texans | 320.0 |
| 21st | New York Giants | 314.3 |
| 22nd | Arizona Cardinals | 314.1 |
| 23rd | Tennessee Titans | 314.0 |
| 24th | Cleveland Browns | 308.9 |
| 25th | Miami Dolphins | 307.7 |
| 26th | Green Bay Packers | 305.7 |
| 27th | Baltimore Ravens | 305.4 |
| 28th | New York Jets | 305.3 |
| 29th | Buffalo Bills | 302.6 |
| 30th | Chicago Bears | 287.4 |
2016 NFL Team Total Yards Per Game Leaders
| Rank | Team | Stat |
|---|---|---|
| 1st | New Orleans Saints | 426.0 |
| 2nd | Atlanta Falcons | 415.8 |
| 3rd | Washington Redskins | 403.4 |
| 4th | New England Patriots | 386.3 |
| 5th | Dallas Cowboys | 376.7 |
| 6th | Oakland Raiders | 373.3 |
| 7th | Pittsburgh Steelers | 372.6 |
| 8th | Green Bay Packers | 368.8 |
| 9th | Arizona Cardinals | 366.8 |
| 10th | Indianapolis Colts | 364.4 |
| 11th | Tennessee Titans | 358.0 |
| 12th | Seattle Seahawks | 357.2 |
| 13th | Cincinnati Bengals | 356.9 |
| 14th | San Diego Chargers | 356.8 |
| 15th | Chicago Bears | 356.5 |
| 16th | Buffalo Bills | 354.1 |
| 17th | Baltimore Ravens | 347.7 |
| 18th | Tampa Bay Buccaneers | 346.4 |
| 19th | Carolina Panthers | 343.7 |
| 20th | Kansas City Chiefs | 343.0 |
| 21st | Detroit Lions | 338.8 |
| 22nd | Philadelphia Eagles | 337.4 |
| 23rd | Jacksonville Jaguars | 334.9 |
| 24th | Miami Dolphins | 332.8 |
| 25th | New York Giants | 330.7 |
| 26th | New York Jets | 329.3 |
| 27th | Denver Broncos | 323.1 |
| 28th | Minnesota Vikings | 315.1 |
| 29th | Houston Texans | 314.7 |
| 30th | Cleveland Browns | 311.0 |
2015 NFL Team Total Yards Per Game Leaders
| Rank | Team | Stat |
|---|---|---|
| 1st | Arizona Cardinals | 408.3 |
| 2nd | New Orleans Saints | 403.8 |
| 3rd | Pittsburgh Steelers | 395.4 |
| 4th | Seattle Seahawks | 378.6 |
| 5th | Tampa Bay Buccaneers | 375.9 |
| 6th | New England Patriots | 374.4 |
| 7th | Atlanta Falcons | 374.1 |
| 8th | New York Giants | 372.0 |
| 9th | San Diego Chargers | 371.8 |
| 10th | New York Jets | 370.3 |
| 11th | Carolina Panthers | 366.9 |
| 12th | Philadelphia Eagles | 364.4 |
| 13th | Buffalo Bills | 360.9 |
| 14th | Baltimore Ravens | 359.3 |
| 15th | Cincinnati Bengals | 358.0 |
| 16th | Denver Broncos | 355.5 |
| 17th | Washington Redskins | 353.8 |
| 18th | Jacksonville Jaguars | 348.8 |
| 19th | Houston Texans | 347.8 |
| 20th | Detroit Lions | 346.7 |
| 21st | Chicago Bears | 344.6 |
| 22nd | Dallas Cowboys | 335.1 |
| 23rd | Green Bay Packers | 334.6 |
| 24th | Oakland Raiders | 333.5 |
| 25th | Cleveland Browns | 331.9 |
| 26th | Miami Dolphins | 331.7 |
| 27th | Kansas City Chiefs | 331.2 |
| 28th | Indianapolis Colts | 321.4 |
| 29th | Minnesota Vikings | 321.2 |
| 30th | Tennessee Titans | 311.8 |
0