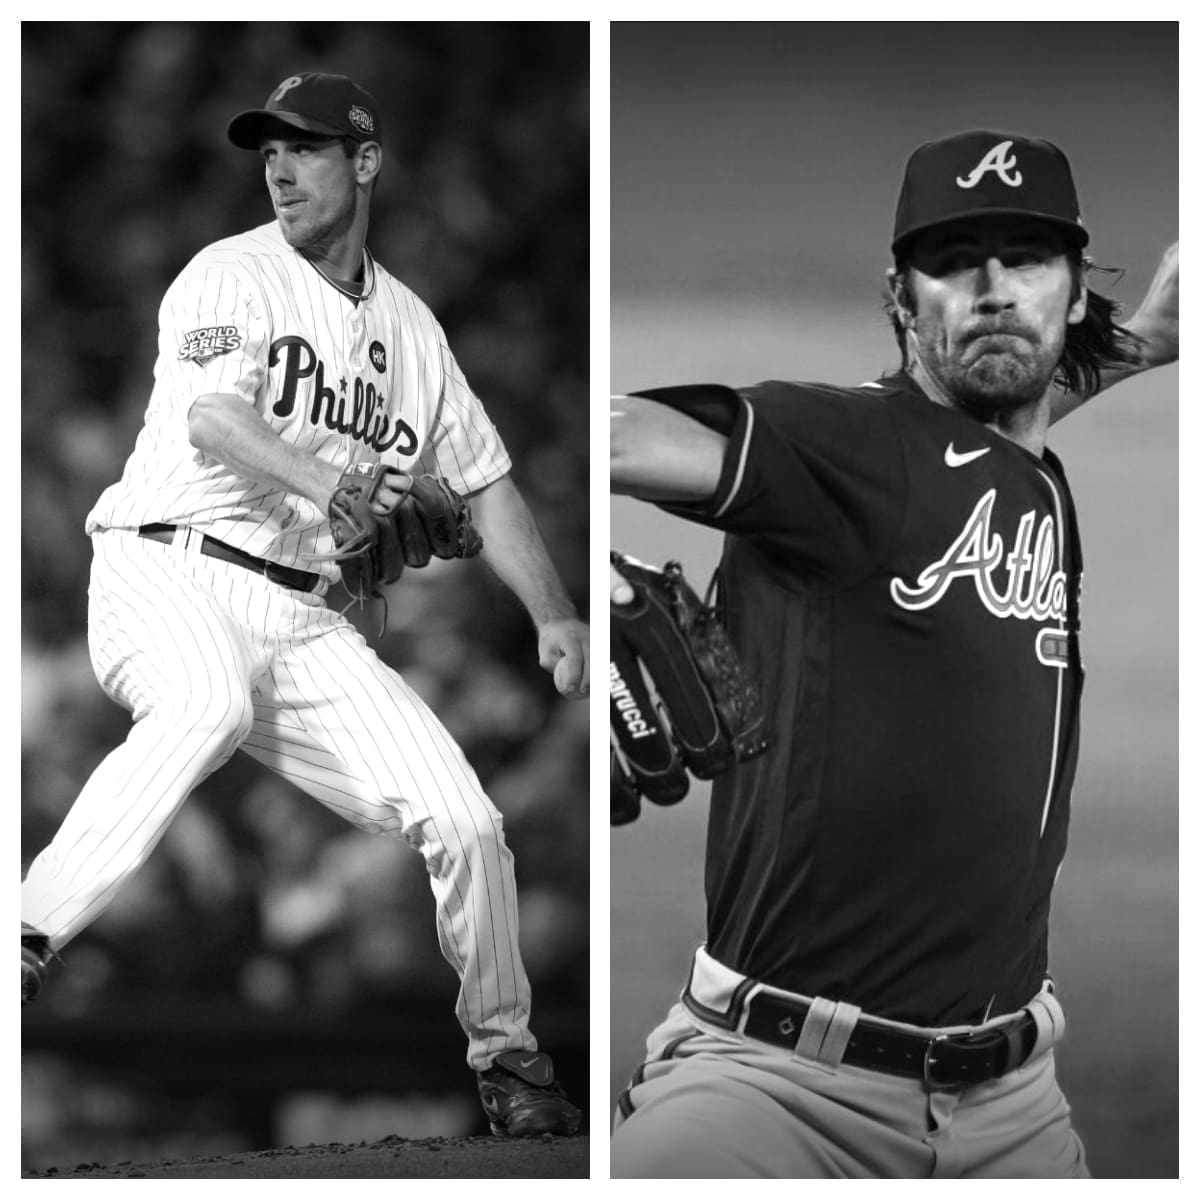
Fried has thrown 1,140 innings and has totaled 1,102 K’s in his career. His ERA is 3.05 (386 earned runs allowed) and his WHIP is 1.145. He has given up 990 base knocks (7.8 hits per 9 innings) and has had 316 walks. Fried (96-44 career mark) holds a FIP of 3.00 while facing 4,655 batters in the majors.
Strider (43-26 record in his career) holds a 3.86 0 while giving up 7.3 hits per 9 innings. His strikeout to walk ratio is 3.73 and he has gone up against 2,046 batters during his pro baseball career. During his pro baseball career, Strider has surrendered 401 hits while tallying 672 punch outs in 494 innings pitched. He has surrendered 212 earned runs while holding a WHIP of 1.176 and a FIP of 3.8.
Max Fried vs Spencer Strider Stats
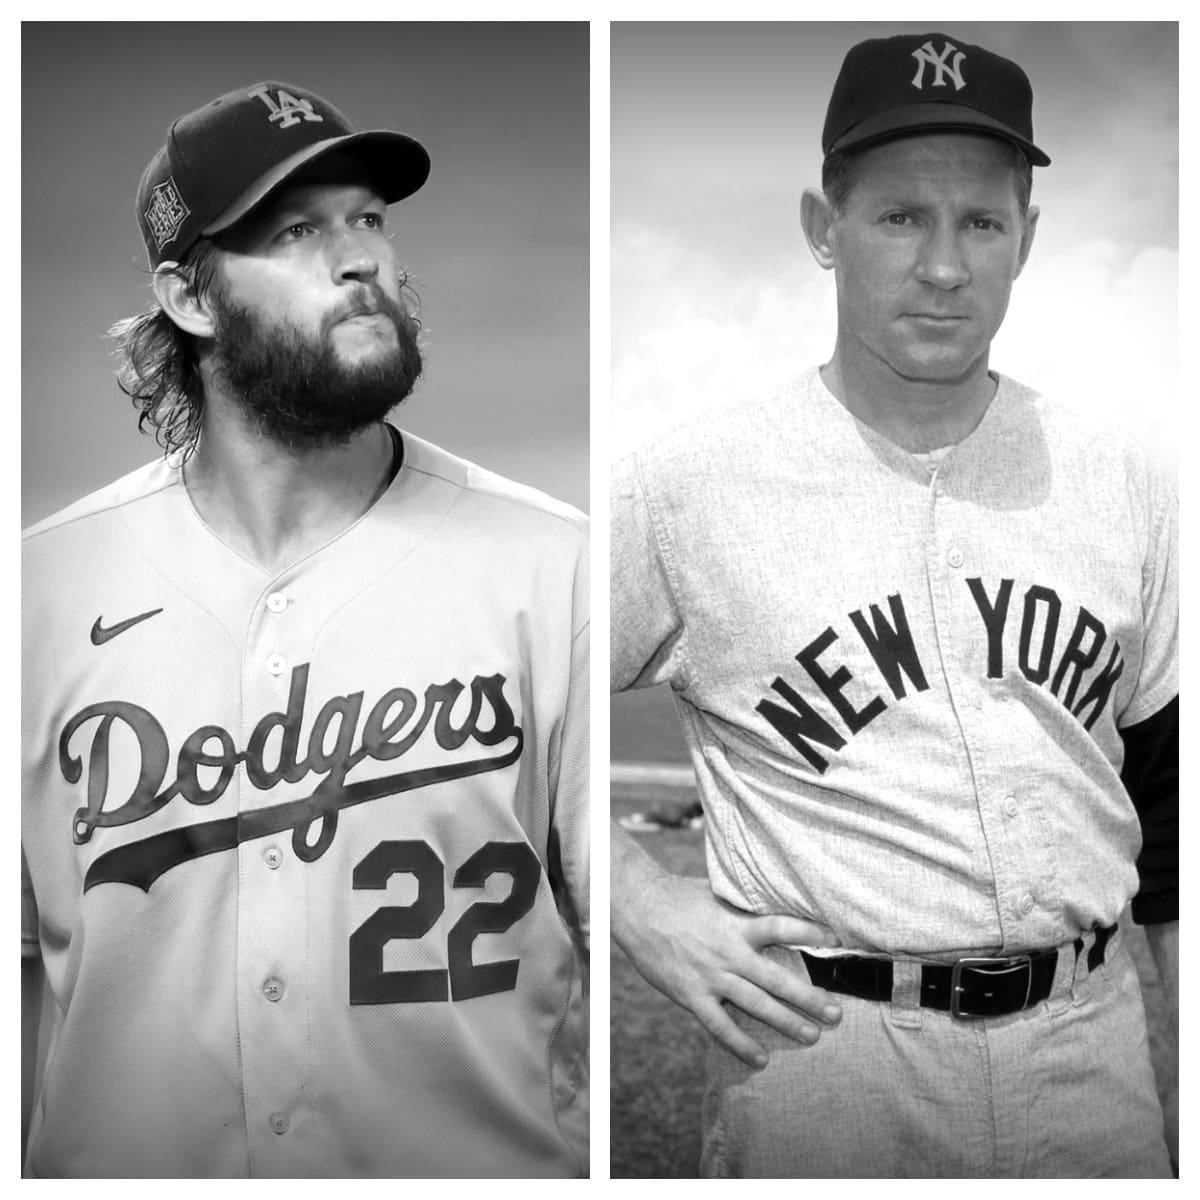
| Tom Seaver | Stat | Whitey Ford |
|---|---|---|
| 311 | Wins | 236 |
| 205 | Losses | 106 |
| 0.603 | W-L% | 0.690 |
| 2.86 | Earned Run Average (ERA) | 2.75 |
| 656 | Games Played | 498 |
| 647 | Games Started | 438 |
| 1.121 | WHIP | 1.215 |
| 2.62 | Strikeout to Walk Ratio (SO/W) | 1.80 |
| 7.5 | Hits Allowed Per 9 Innings | 7.9 |
| 1 | Saves | 11 |
| 4,783 | Innings Pitched | 3,170 |
| 3,971 | Hits Allowed | 2,766 |
| 1,674 | Runs Allowed | 1,107 |
| 1,521 | Earned Runs Allowed | 967 |
| 380 | Home Runs Allowed | 228 |
| 1,390 | Walks | 1,086 |
| 116 | Intentional Walks | 49 |
| 3,640 | Strikeouts | 1,956 |
| 19,369 | Batters Faced | 13,036 |
| 6.8 | Strikeouts Per 9 Innings | 5.6 |
| 3.04 | Fielding Independent Pitching (FIP) | 3.26 |