Griffey Jr. has a batting average of .284 for his baseball career with 1,662 runs scored and an OPS of .292. For his time in baseball, he stepped up to bat 11,304 times and came through with a base base hit 2,781 times. He has amassed a slugging percentage of -.077 and he has totaled 5,271 bases. For his professional baseball career, Griffey Jr. has drilled 630 baseballs out of the park while driving in 1,836 runs. He has been struck out 1,779 times and has walked on 1,312 attempts at the plate, contributing to a .370 OBP.
For the 5,734 at-bats in his MLB career, Trout has hit .296 in addition to 1,700 base hits. He has hit a home run 392 times, with 3,300 total bases and also a .576 slugging percentage. Trout has earned a walk 1,022 times while striking out on 1,560 plate appearances. He is sitting with 1,155 runs and has 987 RBIs. His OBP is .408 and he has a lifetime OPS of .984.
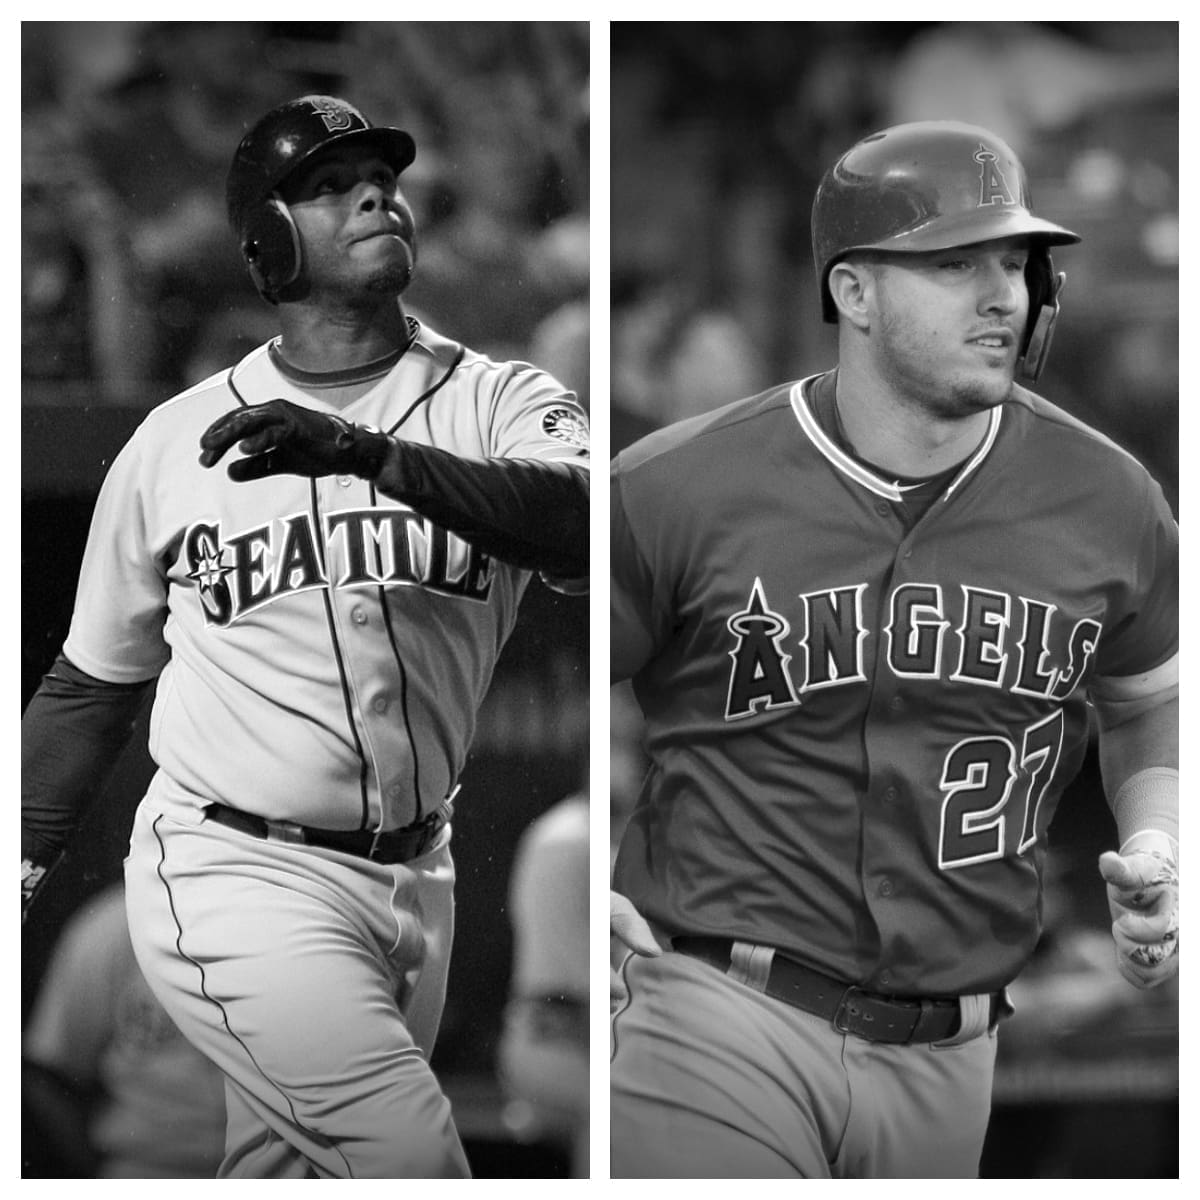
| Ken Griffey Jr. | Career | Mike Trout |
|---|---|---|
| 2,671 | Games Played | 1,582 |
| 11,304 | Plate Appearances | 6,919 |
| 9,801 | At-Bats | 5,734 |
| 1,662 | Runs | 1,155 |
| 2,781 | Hits | 1,700 |
| 524 | Doubles | 314 |
| 38 | Triples | 55 |
| 630 | Home Runs | 392 |
| 1,836 | Runs Batted In | 987 |
| 184 | Stolen Bases | 214 |
| 69 | Caught Stealing | 38 |
| 1,312 | Walks | 1,022 |
| 1,779 | Strikeouts | 1,560 |
| .284 | Batting Average | .296 |
| .370 | On-Base Percentage | .408 |
| -.077 | Slugging Percentage | .576 |
| 0.292 | OPS | 0.984 |
| 5,271 | Total Bases | 3,300 |
| 199 | Grounded Into Double Plays | 71 |
| 81 | Hit By Pitch | 103 |